
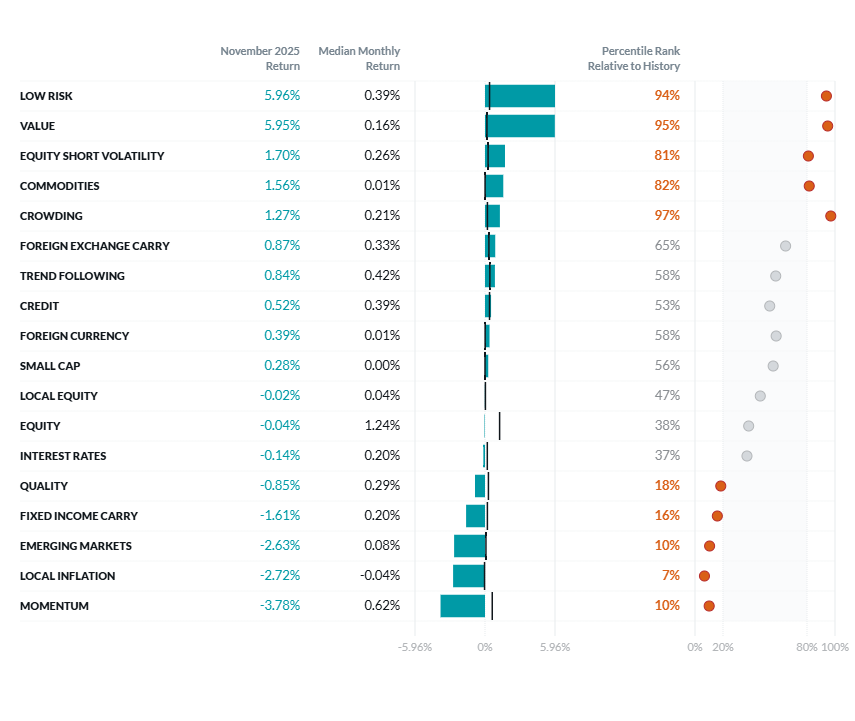
Exhibit 1: Two Sigma Factor Lens Performance in November
©2025 Two Sigma Investments, LP. This image is for informational purposes only. See https://www.venn.twosigma.com/blog-disclaimer for more disclaimers and disclosures.
Source: Venn by Two Sigma. The median and percentile columns measure the performance of each factor in the Two Sigma Factor Lens relative to the entire history of the factor in USD, using monthly data for the period August 1998 - November 2025

Core Macro: Many of our factors begin with a “raw input”, which typically is comprised of indexes or Venn-built portfolios. Our final factor is typically the result of return adjustments to that raw input, such as making it in excess of the risk-free rate, residualization to achieve orthogonality, currency neutralization, or volatility scaling.
In the case of our Commodities factor, its index-based raw input has an allocation of 19.40% and 7.11% to Gold and Silver respectively.1 These assets have been topping headlines in 2025, as a variety of tailwinds have caused impressive performance.2 This has impacted the raw input for the Commodity factor directly, and then our final Commodity factor a little further downstream (after return adjustments).
For example, Gold and Silver were up 4.46% and 10.07% in November.3 Our factor’s raw input was up 3.22%, and our actual Commodities factor was up 1.56%, with the latter being a monthly return in the top 20% of historical returns.
As we can see in Exhibit 2, our final Commodity factor has around a 0.85 correlation to its raw input both historically and YTD, despite being decorrelated from higher tier factors such as Equity and Interest Rates.
Exhibit 2: Correlations and Returns of Commodities Factor (Raw Input and Final), Precious Metals, Equity, and Interest Rate Factors
%2c%20Precious%20Metals%2c%20Equity%2c%20and%20Interest%20Rate%20Factors.png) Source: Venn by Two Sigma.
Source: Venn by Two Sigma.
When looking at correlations to representative Gold and Silver exposures, we see that these components have been similarly correlated to the raw input and final factor. This is great validation that our factor has been an effective measure of Commodity risk, similar to a commodity index, but without the exposure to other macro risks.
Across both our Commodities factor and its raw input, correlations with Gold and Silver have been higher YTD than historically, and quite meaningful. This underscores the role these precious metals have played from both an asset class-based perspective of commodities and also a purer expression of commodity risk via Venn’s Commodities factor.
Secondary Macro: We have written extensively about Local Inflation as of late due to tariffs. It represents the value of a pure inflation hedge, beyond what's entangled with higher tier factors such as Equity, Interest Rates, Credit, and Commodities.
Given that the implementation of an inflation hedge is expected to be a drag on return in environments without higher than expected inflation, this factor is typically negative as it’s short the inflation risk premium. Extremely negative performance, such as the -2.72% in November, suggests that investors with long exposure to the inflation risk premium have been compensated relatively more as of late, which makes sense as inflation associated with tariffs continues to be a top market worry that has yet to materialize.
Macro Styles: Fixed Income Carry goes long higher yielding developed 10-year sovereign bonds, and short lower yielding ones, with positioning determined by each country’s term spread. All else equal, this factor aims to capture the yield or “carry” from this positioning.
Despite constructing our factor to be duration neutral and residualized against our Interest Rates factor, movements in bond prices still meaningfully affect performance, especially over the short term.
For example, a short position in U.S. 10-Year futures was the clear primary driver of negative performance in November as the bond’s yield fell from 4.10% to 4.02%. This was in part driven by signs of a weaker labor market, which provided some evidence that the Fed was still on track to cut in December.4
Exhibit 3: Fixed Income Carry Factor Cumulative Return and U.S. 10-Year Yield
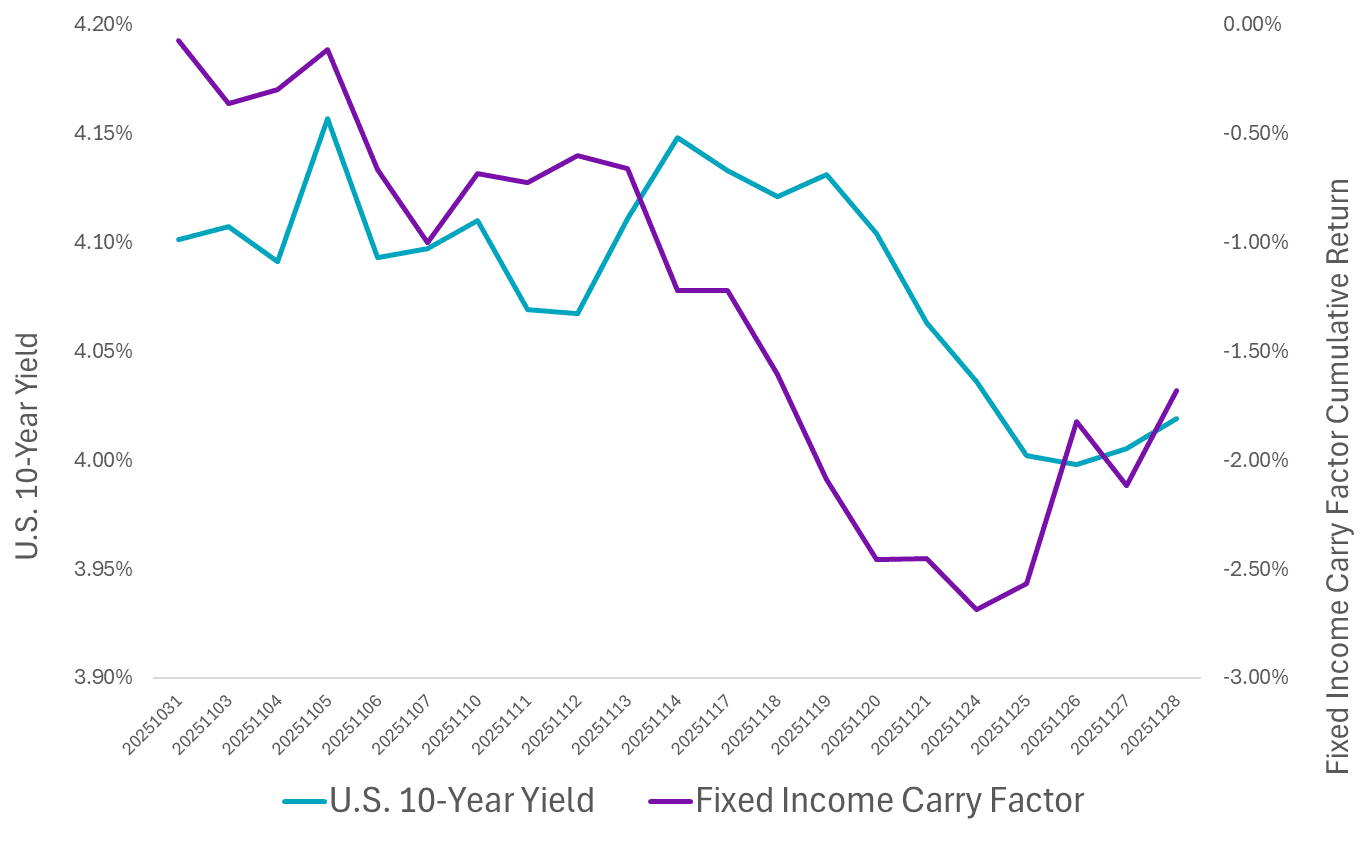 Source: CSI, Venn by Two Sigma.
Equity Styles: Venn’s Equity Style Factors are global market neutral portfolios. Value, for example, are long companies that are cheaper relative to their intrinsic value, and short those that are relatively more expensive.
We have often written about the consistent short position this factor takes in the Tech sector, which for the month of November, benefitted the factor as worries of overvalued AI stocks continue to percolate in markets. But to be fair, our Value factor captured positive performance within every GICS sector except for healthcare.
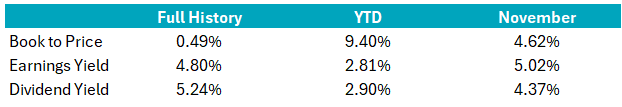
An interesting analysis is breaking out our factor by its separate components: Book to Price (B/P), Dividend Yield, and Earnings Yield, and observing the performance of those fundamentals as if they were their own long/short portfolio using our same methodology.
Over the full history of our factor, all three have been positive, but B/P, a fundamental that is commonly used as a value signal but has been under some scrutiny over recent years,5 has had notably lower performance.
Exhibit 4: Value Factor Implementations Using Only Individual Components
Source: Venn by Two Sigma.
However, looking at YTD performance in Exhibit 4, B/P has been a clear standout at 9.40% cumulative return, and has kept pace in November with our other two metrics. We could postulate as to why, but focusing on the implication of this is much more concrete and may be equally important.
While definitions of Value are broad, it’s fair to say that traditional interpretations often include this metric. For example, Venn continues to use this component because it remains a strong explainer of institutional portfolio risk.
When looking at rolling 5-year returns in Exhibit 5, it’s clear that the spread in returns between B/P and the other components has significantly compressed. When B/P is an effective signal to generate meaningful positive returns, that typically bodes well for traditional Value exposures broadly, and as a result, institutional portfolios with this exposure.
Exhibit 5: Value Factor Implementations Rolling 5-Year Returns
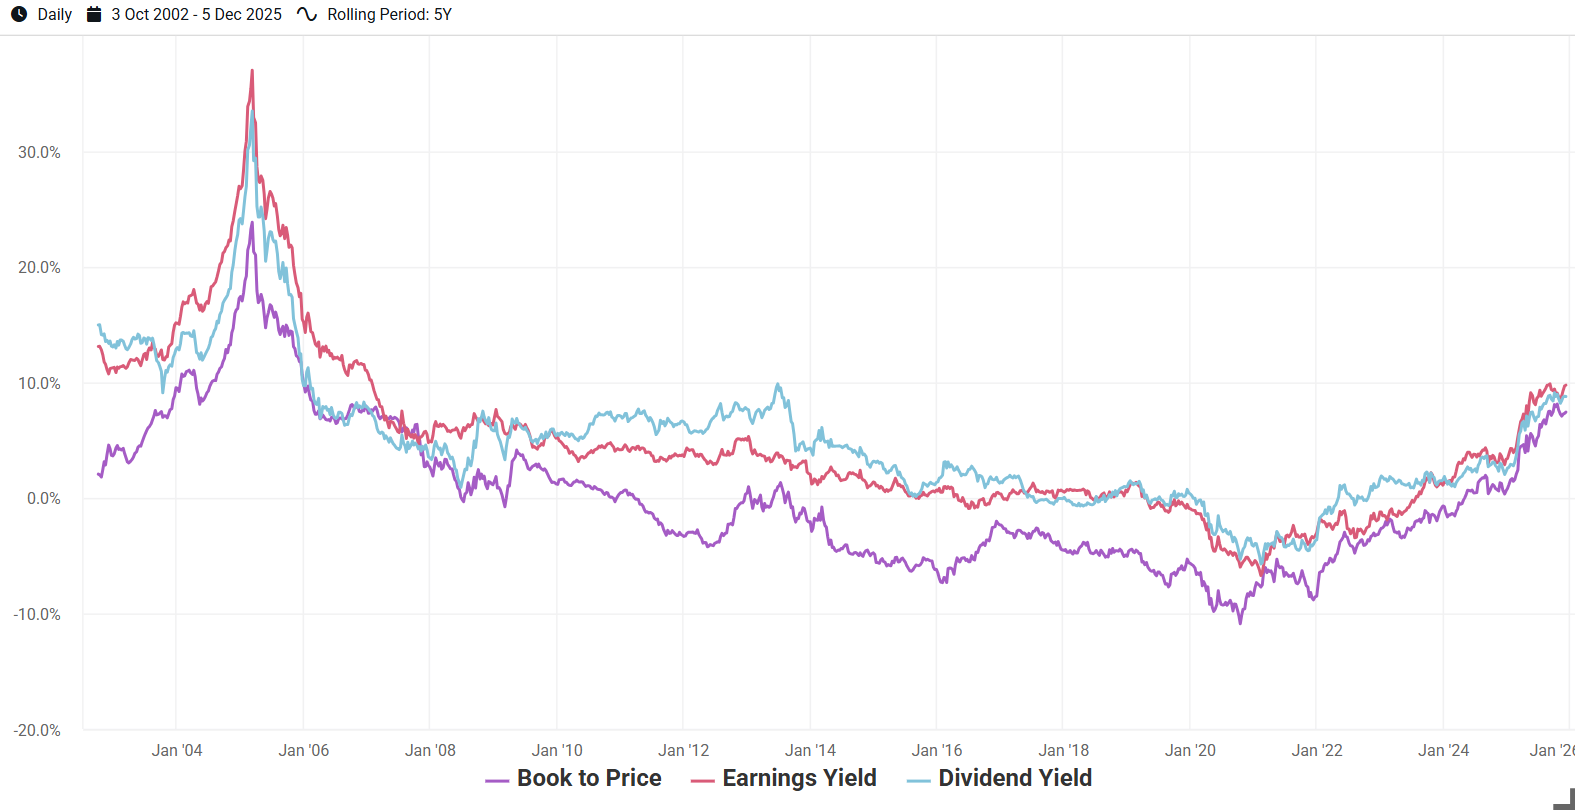 Source: Venn by Two Sigma.
References
1 As of 11/28/2025. https://assets.bbhub.io/professional/sites/27/BCOM.pdf
2 https://blogs.worldbank.org/en/opendata/when-uncertainty-rises--gold-rallies
3 As measured by the iShares Gold Trust (IAU) and the iShares Silver Trust (SLV).
4 https://www.cnbc.com/2025/11/25/us-treasury-yields-fed-cut-remains-in-focus.html
Exposure to risk factors is not a guarantee of increased performance or decreased risk. References to the Two Sigma Factor Lens and other Venn methodologies are qualified in their entirety by the applicable documentation on Venn.
This article is not an endorsement by Two Sigma Investor Solutions, LP or any of its affiliates (collectively, “Two Sigma”) of the topics discussed. The views expressed above reflect those of the authors and are not necessarily the views of Two Sigma. This article (i) is only for informational and educational purposes, (ii) is not intended to provide, and should not be relied upon, for investment, accounting, legal or tax advice, and (iii) is not a recommendation as to any portfolio, allocation, strategy or investment. This article is not an offer to sell or the solicitation of an offer to buy any securities or other instruments. This article is current as of the date of issuance (or any earlier date as referenced herein) and is subject to change without notice. The analytics or other services available on Venn change frequently and the content of this article should be expected to become outdated and less accurate over time. Two Sigma has no obligation to update the article nor does Two Sigma make any express or implied warranties or representations as to its completeness or accuracy. This material uses some trademarks owned by entities other than Two Sigma purely for identification and comment as fair nominative use. That use does not imply any association with or endorsement of the other company by Two Sigma, or vice versa. See the end of the document for other important disclaimers and disclosures. Click here for other important disclaimers and disclosures.