
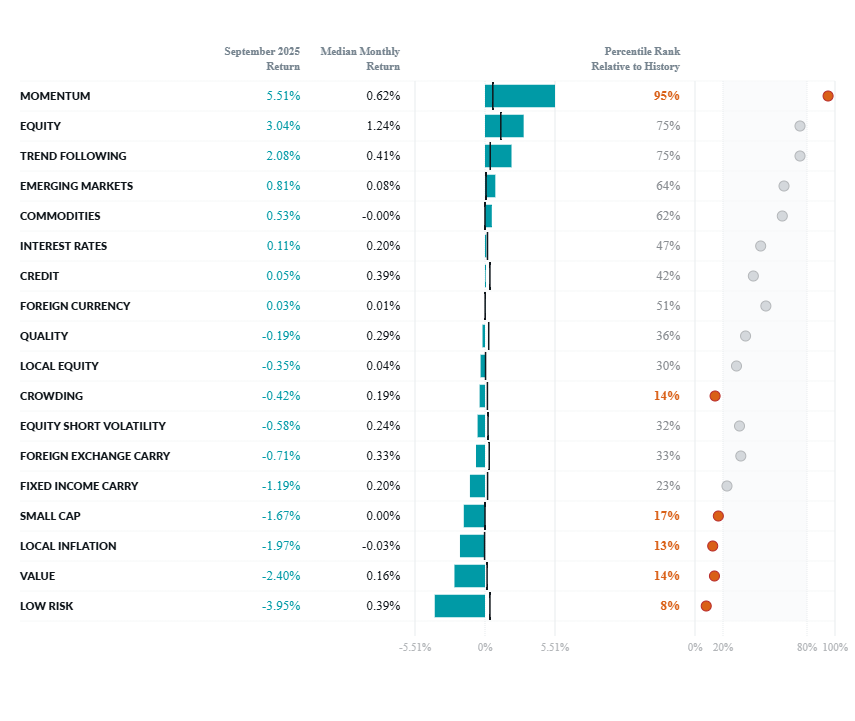
Exhibit 1: Two Sigma Factor Lens Performance in September
©2025 Two Sigma Investments, LP. This image is for informational purposes only. See https://www.venn.twosigma.com/blog-disclaimer for more disclaimers and disclosures.
Source: Venn by Two Sigma. The median and percentile columns measure the performance of each factor in the Two Sigma Factor Lens relative to the entire history of the factor in USD, using monthly data for the period August 1998 - September 2025
Constructing the Local Inflation Factor
In the USD version of Venn’s factor lens, the Local Inflation factor begins with a fundamental inflation hedge: a long position in a 7-10 year Treasury Inflation-Protected Securities index (TIPS), versus a short position in an equivalent nominal Treasuries index.2 This spread captures the market's valuation of inflation protection.
However, conventional inflation hedges share risk exposures with broader market factors. When inflation expectations shift dramatically, our Interest Rates factor may predictably move alongside the spread between TIPS and nominal Treasuries.
Using Venn's risk consolidation framework, we isolate shared risks within the most liquid and high capacity factors to promote actionable insights. In this case, capturing the correlated risk between rates and our inflation hedge within our Interest Rates factor.
As a result, our final Local Inflation factor is the output of residualizing the TIPS-Treasury spread against Equity, Interest Rates, Credit, and Commodities factors. This decorrelates our Local Inflation factor with the higher-tier ones, isolating inflation risk unique from these more liquid factors.
Interpreting the Local Inflation Factor
How should investors interpret this decorrelated Local Inflation factor in practice?
It captures the value of hedging against unique inflation dynamics that are not found in higher-tier factor exposures.
In typical market environments, this factor would be expected to carry a negative expected return as investors are short the inflation risk premium embedded in nominal bonds. On the other hand, positive performance would be expected when inflation surprises to the upside and the inflation-linked aspect of the long position pays off.
When inflation expectations decline, the value of this hedge diminishes as well. September shows how our Local Inflation factor declined alongside 10-year breakevens (Exhibit 2), posting one of its most negative monthly performances on record (Exhibit 1).
Exhibit 2: Local Inflation Factor Performance alongside 10-Year Breakevens in September
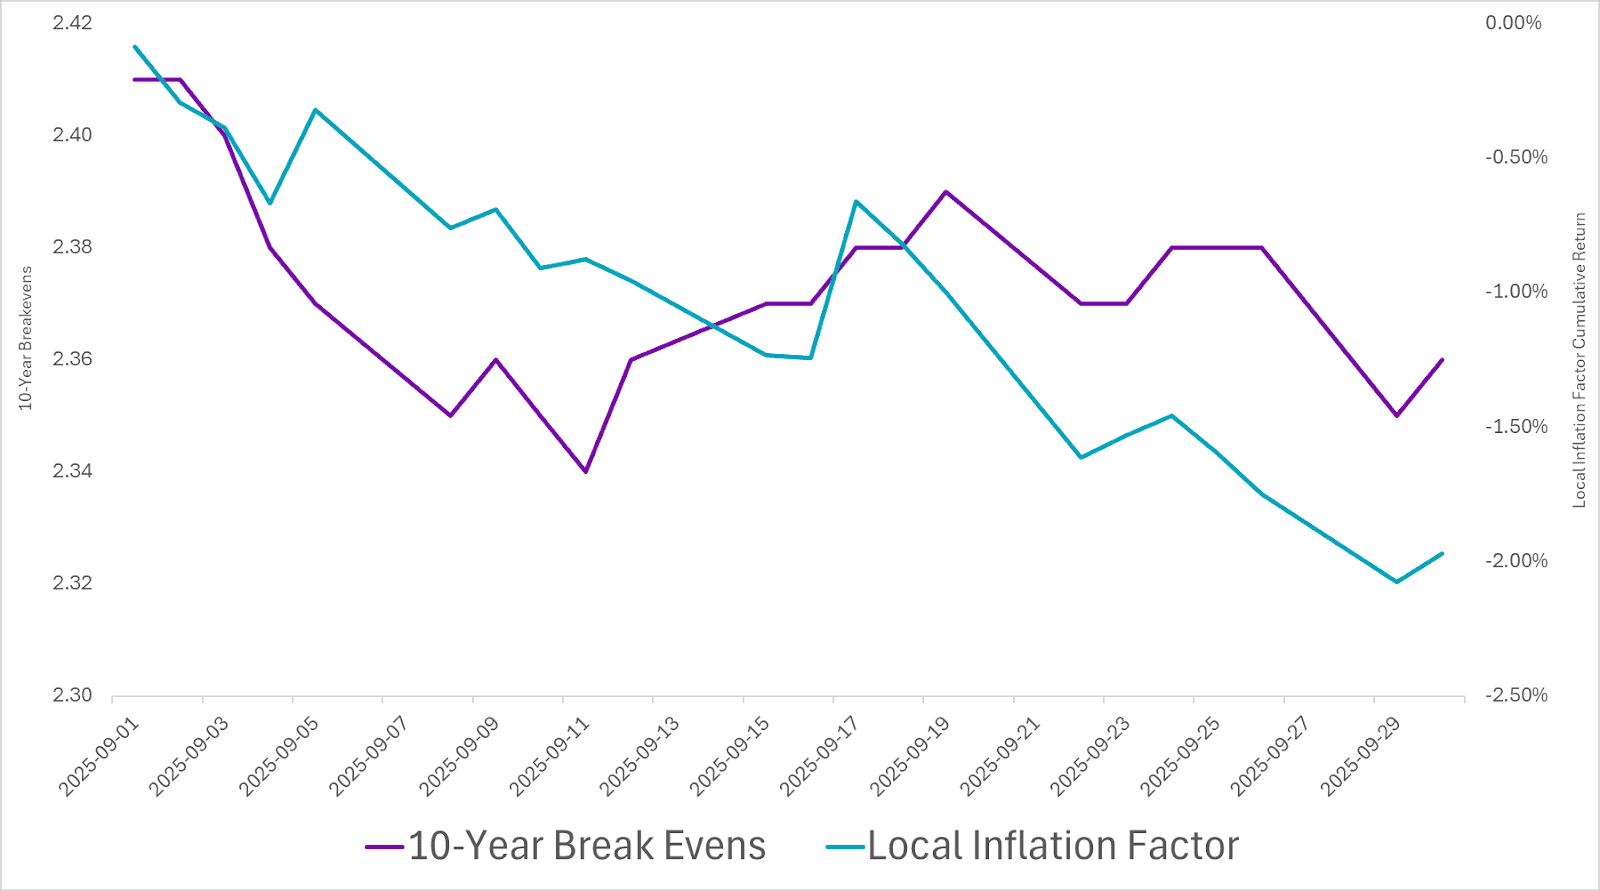 Source: Venn by Two Sigma. St. Louis Fed.
Analyzing Historical Local Inflation Factor Performance
The trailing 5-year performance of our Local Inflation factor reflects key shifts in the U.S. inflation narrative across four distinct phases:
Exhibit 3: Trailing 5-Year Local Inflation Factor Performance
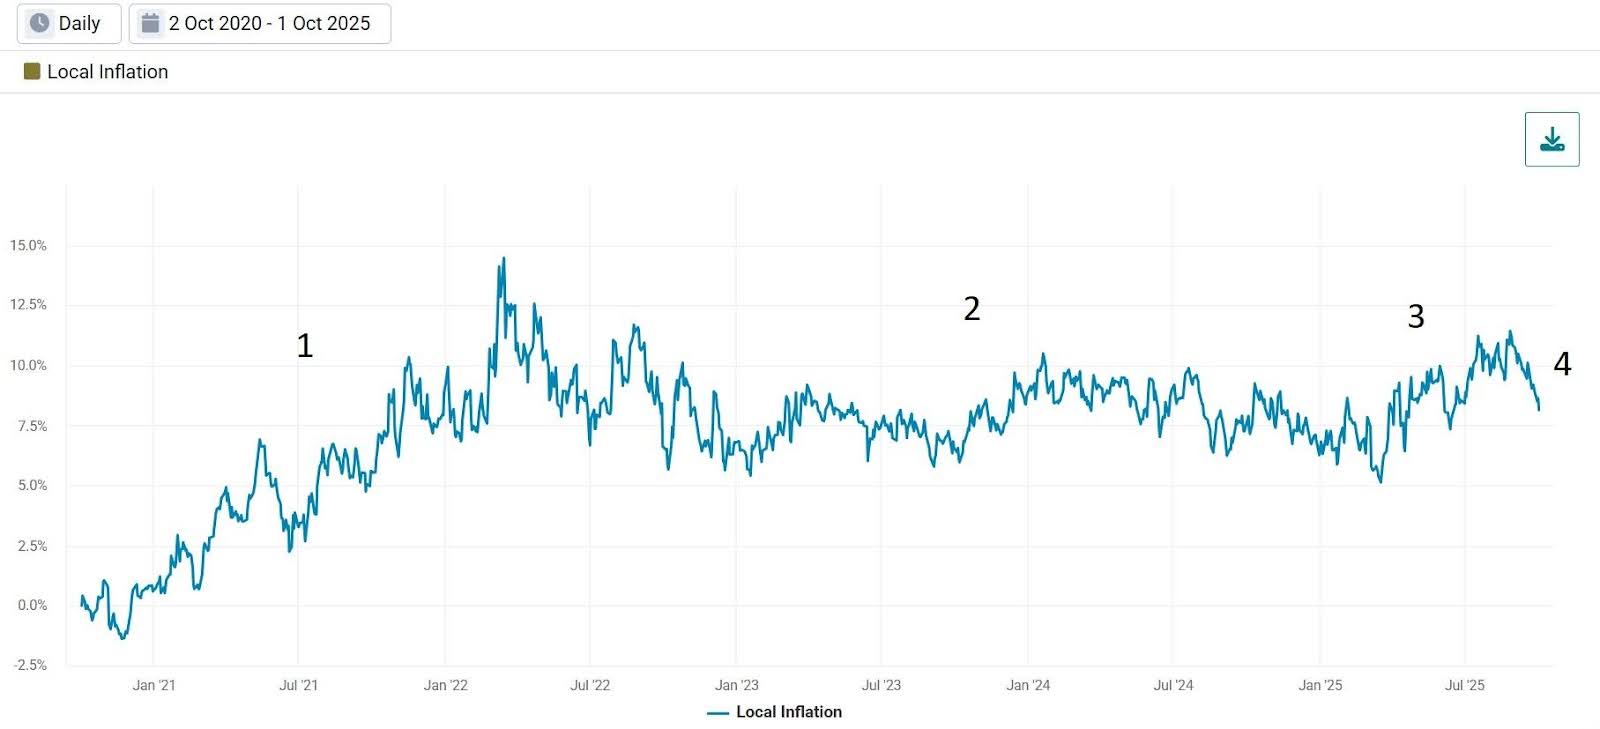
1. 2021–Early 2022: Post-COVID inflation expectations rose rapidly, resulting in those with meaningful exposure to our Local Inflation factor to benefit.
2. 2022–Early 2025: Federal Reserve rate hikes beginning in March of 2022 stabilized inflation expectations, but levels remained elevated relative to pre-pandemic norms. Local Inflation factor performance moderated accordingly.
3. Early 2025–August: A new administration began in the U.S., and tariff policy announcements renewed inflation concerns. This drove positive Local Inflation factor performance as markets repriced inflation expectations.
4. September 2025: After 271 days, the Federal Reserve continued cutting rates, signaling confidence that tariff-related inflation pressures had not materialized and lowering the value of implementing an inflation hedge
Using the Local Inflation Factor as a Tool
It is important to remember that the Two Sigma Factor Lens serves primarily as a portfolio analytics tool, delivering the most value when applied to manager or portfolio analytics.
Consider the comparison in Exhibit 4, which analyzes factor exposures for the Global X Silver Miners ETF alongside the iShares TIPS Bond ETF over the past five years.
We selected silver miners for this analysis given their stellar recent performance and complex risk profile spanning equities, commodities, foreign currency, and interest rates, while also being thought of as an inflation hedge. This complexity makes them an ideal candidate to demonstrate how factor analysis can isolate specific risk contributions. In this case, sifting through the noise to reveal the inflation hedging component that is unique among its other exposures.
Exhibit 4: Two Sigma Factor Lens Exposures for Silver Miners and TIPS
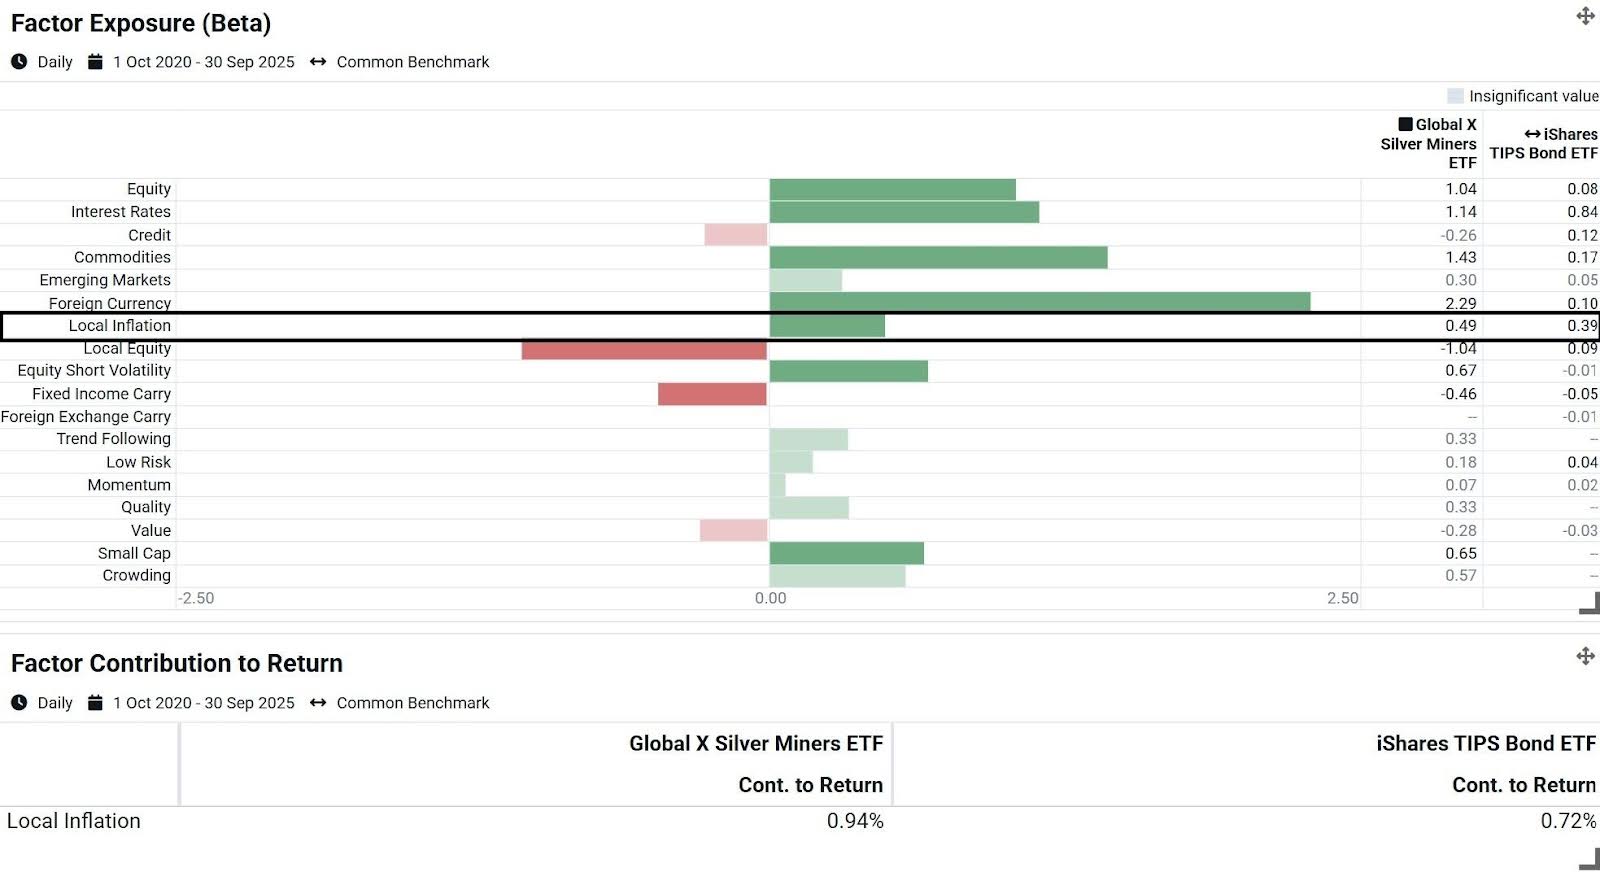
Despite recently falling, the Local Inflation factor has been positive over the last 5 years. As a result, positive exposure translated into meaningful benefits for both funds, though the silver miners ETF's higher beta contributed an extra 22 basis points per year.
This analysis demonstrates one of Venn's key value propositions: its factor lens applies to any asset with a return stream, enabling a common language of risk across multi-asset portfolios.
Local Inflation Factor Exposure in the Current Environment
The Local Inflation factor recognizes that certain inflation risks cannot be managed as part of our Equity, Interest Rates, Credit, or Commodity factor exposures. For investors navigating an uncertain inflation environment, we believe this provides an additional lens for more precise risk management decisions.
Looking ahead, if tariff-related concerns continue to subside and the Federal Reserve maintains orderly rate cuts, exposure to our Local Inflation factor may continue being a headwind on returns. Conversely, any resurgence of inflation pressures, whether from trade policy or other sources, could quickly restore the value of this inflation insurance policy.

References
1 https://www.bls.gov/charts/consumer-price-index/consumer-price-index-by-category-line-chart.htm
2 This factor is also volatility scaled to 7%.
Exposure to risk factors is not a guarantee of increased performance or decreased risk.
References to the Two Sigma Factor Lens and other Venn methodologies are qualified in their entirety by the applicable documentation on Venn.
This article is not an endorsement by Two Sigma Investor Solutions, LP or any of its affiliates (collectively, “Two Sigma”) of the topics discussed. The views expressed above reflect those of the authors and are not necessarily the views of Two Sigma. This article (i) is only for informational and educational purposes, (ii) is not intended to provide, and should not be relied upon, for investment, accounting, legal or tax advice, and (iii) is not a recommendation as to any portfolio, allocation, strategy or investment. This article is not an offer to sell or the solicitation of an offer to buy any securities or other instruments. This article is current as of the date of issuance (or any earlier date as referenced herein) and is subject to change without notice. The analytics or other services available on Venn change frequently and the content of this article should be expected to become outdated and less accurate over time. Two Sigma has no obligation to update the article nor does Two Sigma make any express or implied warranties or representations as to its completeness or accuracy. This material uses some trademarks owned by entities other than Two Sigma purely for identification and comment as fair nominative use. That use does not imply any association with or endorsement of the other company by Two Sigma, or vice versa. See the end of the document for other important disclaimers and disclosures. Click here for other important disclaimers and disclosures.