


In late 2022, ChatGPT captured the world’s imagination and, in some ways, misled it as well. Many hailed large language models as a breakthrough, but were they really?
The reality is that elements of large language models have been a part of people’s lives for quite some time. While recent advancements are exciting, in many ways, the evolution of this space has been quite natural. It may be more akin to the advancements we have seen in computers broadly, rather than the Terminator’s Skynet.
In a similar vein, investing in AI related equities may feel like something new, but the resulting exposure in portfolios may be more familiar than one might think. To test this theory, we decompose the exposure, risk, and return of one of the most accessible ways to capture the AI theme: exchange-traded funds (ETFs).
More specifically, let’s look at the Global X Artificial Intelligence and Technology ETF (AIQ)1 using the Two Sigma Factor Lens. To be clear, AIQ is a portfolio that invests in equities that stand to benefit from further growth in AI, not a portfolio generated through the use of AI techniques.
What Systematic Risk Factors Does AI Have Exposure To?
It is important to note that when analyzing a style, sector, or AI related investment fund, if it is long-only equities, then there is a very strong chance that the majority of its exposure, risk, and return is driven by our Equity factor. Put another way, your AI equity ETF likely belongs in your equity sleeve, not in your alt sleeve.2
Relative to benchmark analysis can help to control for this dominant equity exposure. This puts more importance on what is driving the active bets of AI related equities, or the relative exposure, risk, and return versus a benchmark.
For example, below we analyze the active exposure of the chosen AI ETF (AIQ) relative to global equities3 and summarize our key findings.
Exhibit 1: AIQ’s Relative Factor Exposure Versus Global Equities
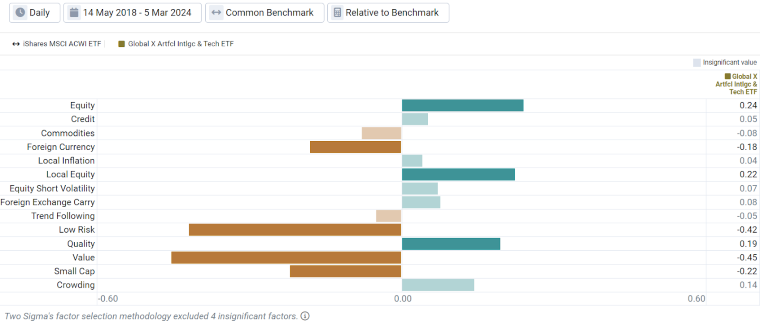
Source: Venn by Two Sigma
- Equity: Even when conducting relative analysis, we see a large positive equity beta for the AI related ETF. This suggests outperformance versus global equities during Equity factor rallies, but also relative underperformance in drawdowns, all else equal.
- Low Risk and Value: Relative to broad global equities, the AI related ETF represents meaningful bets on high risk and expensive securities, which typically underperform their lower risk and cheaper counterparts over the long term.
- Quality, Crowding, and Small Cap: The AI related ETF has had an active bet on both higher quality and lower short interest stocks. Both of these exposures relative to the market would be expected to provide value over time.
Notably, this AI related ETF has also exhibited a large cap bias relative to global equities via negative Small Cap exposure. Some might argue that over full market cycles small caps should outperform, but our beta-neutral Small Cap factor suggests that’s not the case. This factor has captured negative returns since its inception in 1997. - Local Equity and Foreign Currency: Relative exposure to these factors suggests that AI equities also represent an active bet on US stocks and USD outperformance.
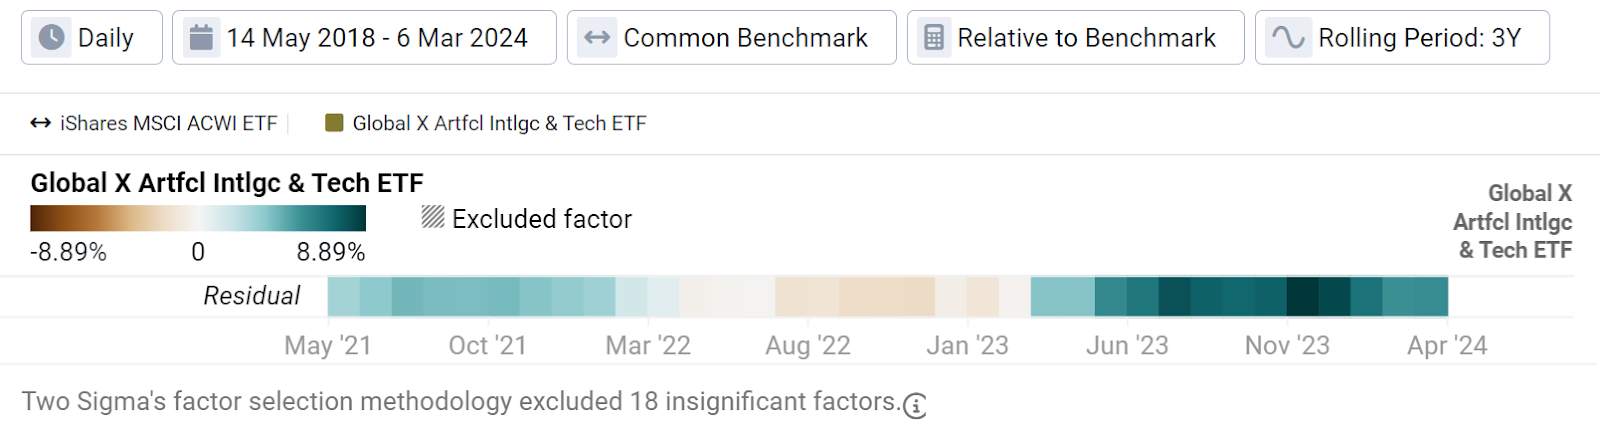
A good question to ask is how consistent these exposures have been over time, especially considering the hype AI has experienced over the last few years. Looking at rolling 3-year factor analysis below, we see that these relative exposures, for the most part, have been present during this ETF’s history. Perhaps most interesting are the recent relative positive exposures to Local Equity, Quality, and Crowding, all three of which have become stronger in recent periods.
In the case of relative Local Equity exposure, this may point to the AI theme having an even deeper sensitivity to US securities as hype has grown. For Quality, trends in relative exposure may mean increased profitability of the AI theme as of late, and for Crowding, it suggests growing hesitancy for market participants to short the AI hype.
Exhibit 2: Trends in AIQ’s Relative Factor Exposure Versus Global Equities
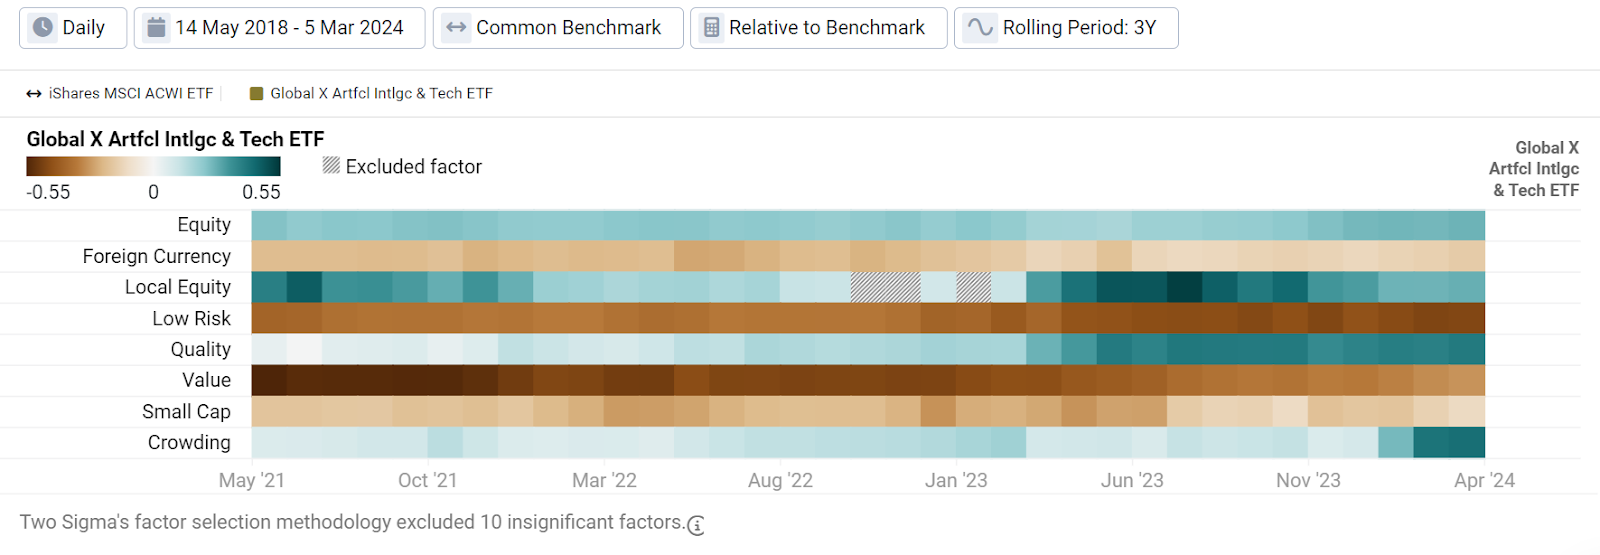
Source: Venn by Two Sigma
How Well Do Systematic Risk Factors Explain AI Risk?
Unlike factor exposure, decomposing active risk comes with an additional term, “residual.” This represents the volatility that cannot be explained by the Two Sigma Factor Lens. Residual can represent a variety of things, including unique manager skill or factors not captured in our holistic lens.
For example, breaking down the AI related ETF’s active risk relative to global equities reveals that 27.37% is unexplainable by our factor lens. This represents the portion of active risk that does not correlate with any of our systematic risk factors. Notably, not all active risk is unexplainable. 55.55% of the active risk is driven by bets on both high risk and expensive stocks, which again, historically have not carried positive return premiums over time.
Exhibit 3: AIQ Factor Contribution to Active Risk Versus Global Equities
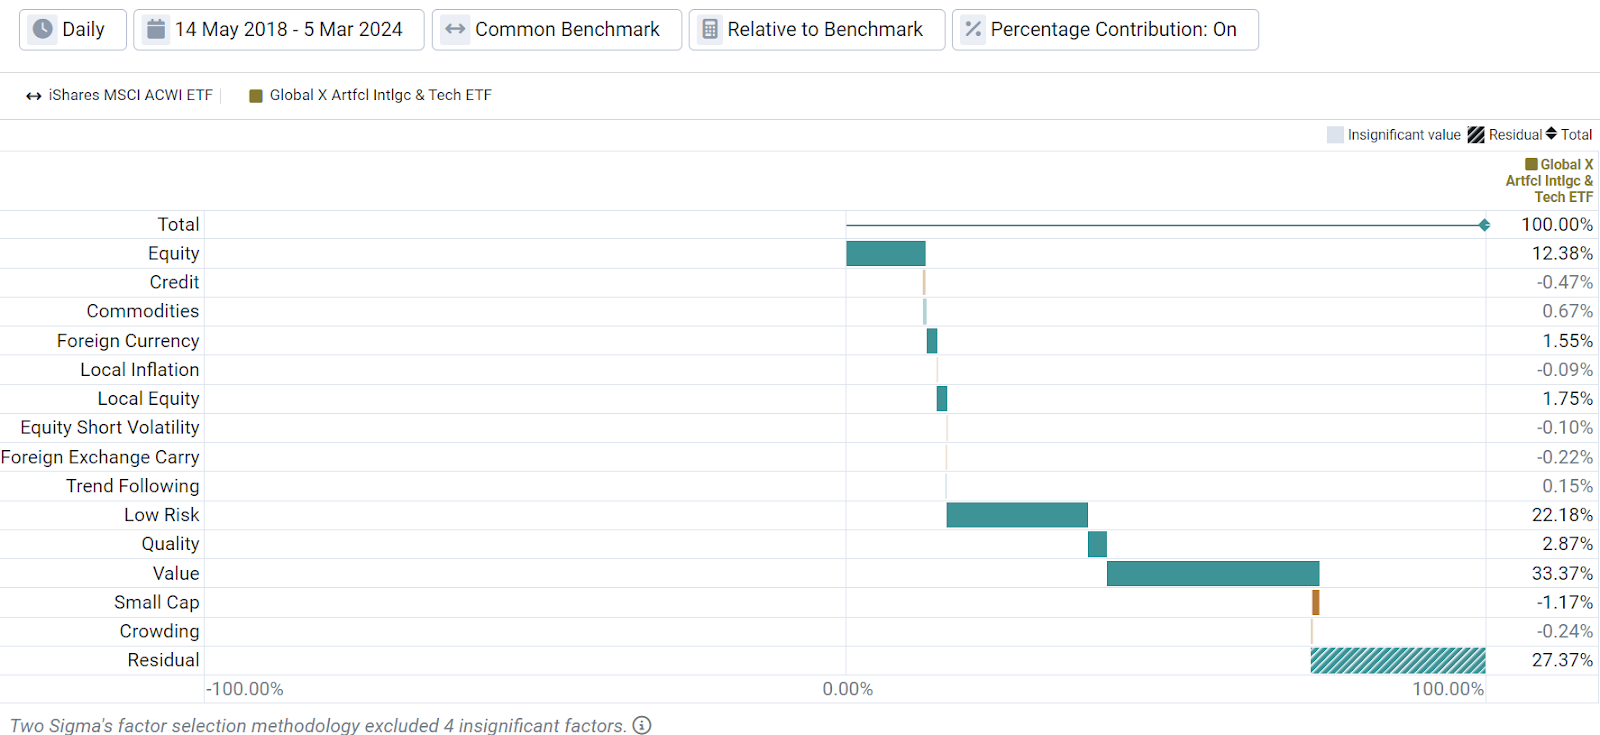
Source: Venn by Two Sigma
We can also break down how these factors have driven active return as well, which in this author’s opinion, is where the most insight can be found. For example, the below chart breaks down this ETF’s 6.68% annualized excess return back to 2018.
Exhibit 4: AIQ Factor Contribution to Active Return Versus Global Equities
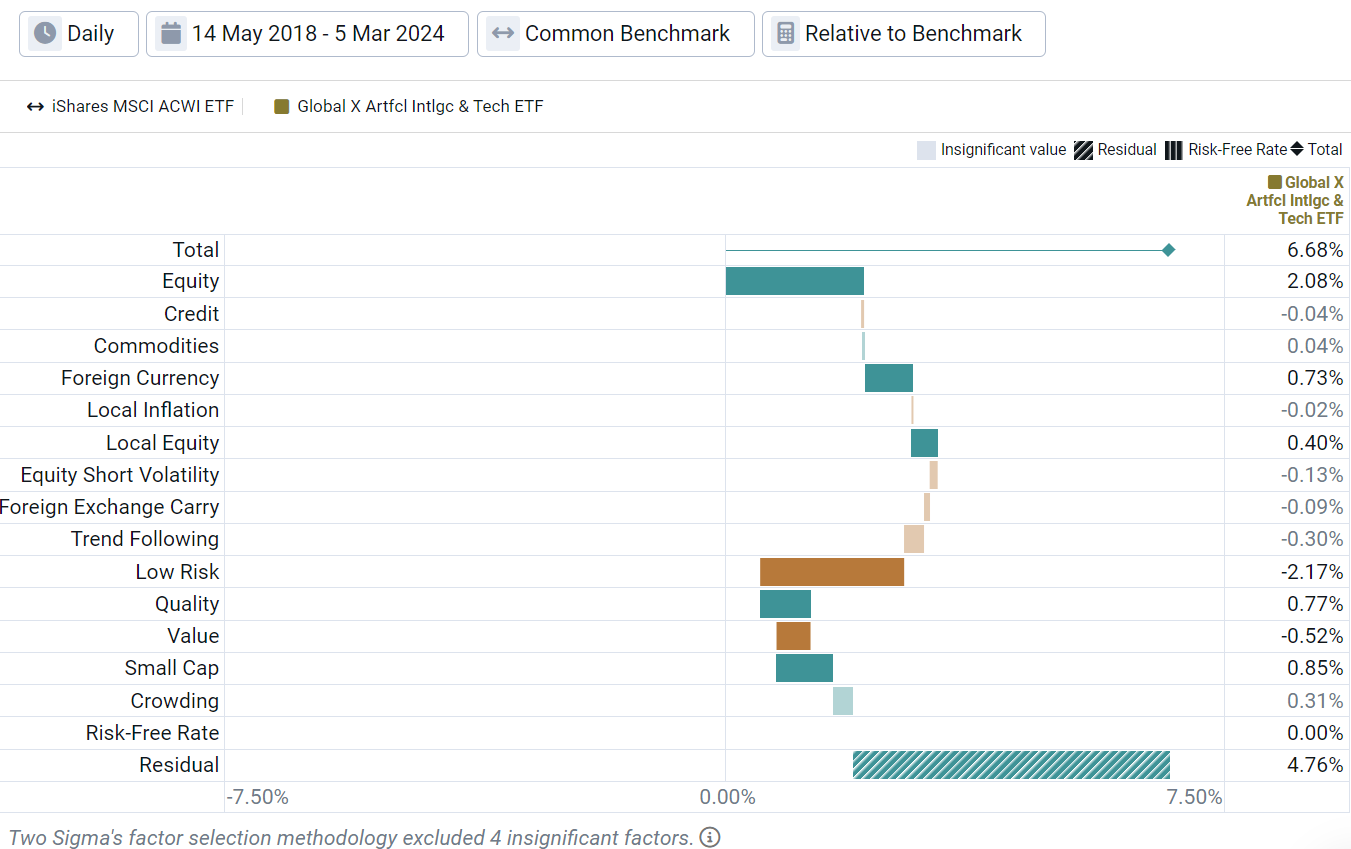
Source: Venn by Two Sigma
Perhaps most interesting in Exhibit 4 is the positive annualized excess return of 4.76% driven by the residual component. This is a meaningful contribution to annualized excess return, despite only driving roughly 25% of the active risk. This provides evidence that AI related equity ETFs have exhibited unique sources of meaningful risk and return, especially when you conduct analysis relative to global equities.
What’s more, if we look at the excess returns that residual contributed over time (Exhibit 5), we see a significant increase in the recent rolling 3-year periods. This coincides with when the AI hype began taking over markets around late 2022.
Exhibit 5: Trends in AIQ’s Residual Contribution to Return Versus Global Equities
Source: Venn by Two Sigma
Moving beyond residual, Exhibit 4 also suggests that relative overweights to high-risk and expensive securities have been a drag on returns, consistent with long term expectations. As of right now, positive residual and equity return (among other factors) have been enough to overcome these headwinds. However, negative relative exposures to known risk premia may become even more important considerations if, for example, relative return due to residual becomes negative. This may coincide with a decline in AI hype, if it ever comes.
Conclusion
With AI taking over the market narrative, more investors may be seeking exposure to this theme. Using factor analysis, we were able to decompose what investing in a long-only AI related equity ETF has meant from a relative exposure, risk, and return perspective, which ultimately can provide investors important context.
Relatively speaking, a bet on AI related equities can be captured by various known systematic risk factors, some of which have historically not been associated with long-term positive return premiums. For example, over half of the active risk of AI related equities has been driven by overweights to high-risk and expensive securities.
However, we also find that the residual component of tracking error with global equities has been meaningful, and what's more, has been a significant driver of excess return. As mentioned earlier, this provides evidence that AI related equity ETFs have exhibited unique sources of meaningful risk and return, especially when you conduct analysis relative to global equities.
Appendix
For additional context, we quickly wanted to show a breakdown of risk for this AI related ETF in the absolute space, now using Bitcoin as the benchmark (below). In this case, let's consider Bitcoin representative of crypto more broadly.
Using absolute analysis (not relative to a benchmark), crypto’s residual has been over 80%, suggesting that our existing lens does not efficiently capture its risk. On the other hand, over 80% of the AI ETF’s risk is driven by our Equity factor with only 5.88% driven by residual. This latter point helps to crystallize why the focus of this piece was on relative analysis of the AI related ETF, as its absolute risk is overwhelmingly driven by our Equity factor.
In the case of AI related equities, on an absolute basis, it does not appear to represent a unique asset experiencing much unique risk, but rather a theme that investors seem to be accessing through equity selection (at least for now). As a counter example, crypto represents what is essentially a new asset class. If it can be proven that a systematic crypto factor is unique and persistent, one could make the case that a Crypto Market Factor may be additive to the Two Sigma Factor Lens. You can read more about this concept as it relates to crypto in a piece Venn wrote in partnership with Coinbase.
Exhibit 6: Absolute Factor Risk Decomposition AIQ and Bitcoin
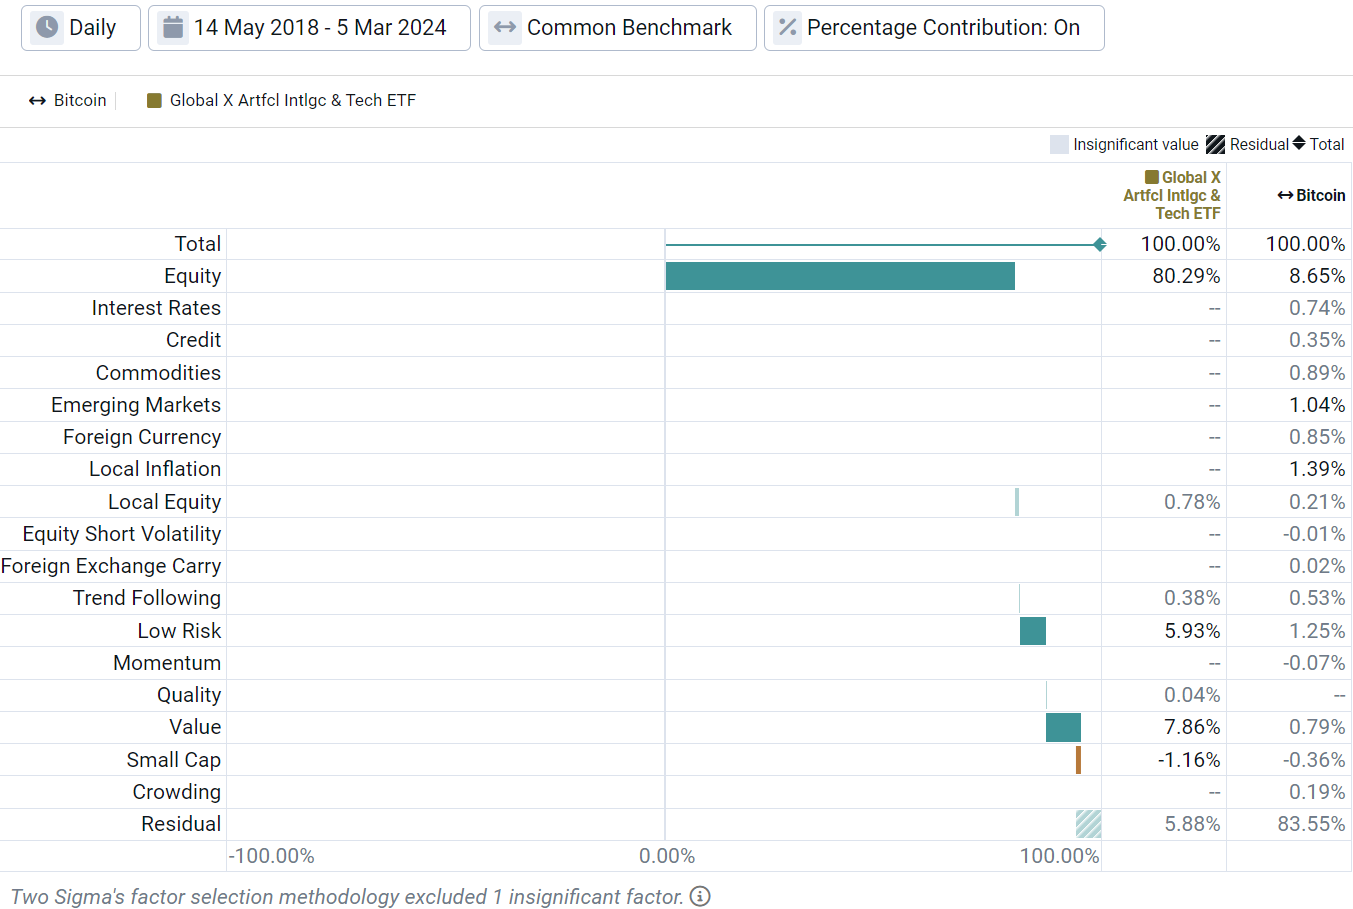
Source: Venn by Two Sigma
References
1 AIQ was selected to represent AI due to its high AUM ($1.41 billion), long track record (incepted 5/11/18), and its modified market-cap weighted approach, which prevents significant concentration in NVIDIA among other securities
2 Please see the appendix below for more detail on this topic.
3 Represented by the iShares MSCI ACWI ETF (ACWI)
References to the Two Sigma Factor Lens and other Venn methodologies are qualified in their entirety by the applicable documentation on Venn.
This article is not an endorsement by Two Sigma Investor Solutions, LP or any of its affiliates (collectively, “Two Sigma”) of the topics discussed. The views expressed above reflect those of the authors and are not necessarily the views of Two Sigma. This article (i) is only for informational and educational purposes, (ii) is not intended to provide, and should not be relied upon, for investment, accounting, legal or tax advice, and (iii) is not a recommendation as to any portfolio, allocation, strategy or investment. This article is not an offer to sell or the solicitation of an offer to buy any securities or other instruments. This article is current as of the date of issuance (or any earlier date as referenced herein) and is subject to change without notice. The analytics or other services available on Venn change frequently and the content of this article should be expected to become outdated and less accurate over time. Any statements regarding planned or future development efforts for our existing or new products or services are not intended to be a promise or guarantee of future availability of products, services, or features. Such statements merely reflect our current plans. They are not intended to indicate when or how particular features will be offered or at what price. These planned or future development efforts may change without notice. Two Sigma has no obligation to update the article nor does Two Sigma make any express or implied warranties or representations as to its completeness or accuracy. This material uses some trademarks owned by entities other than Two Sigma purely for identification and comment as fair nominative use. That use does not imply any association with or endorsement of the other company by Two Sigma, or vice versa. See the end of the document for other important disclaimers and disclosures. Click here for other important disclaimers and disclosures.
This article may include discussion of investing in virtual currencies. You should be aware that virtual currencies can have unique characteristics from other securities, securities transactions and financial transactions. Virtual currencies prices may be volatile, they may be difficult to price and their liquidity may be dispersed. Virtual currencies may be subject to certain cybersecurity and technology risks. Various intermediaries in the virtual currency markets may be unregulated, and the general regulatory landscape for virtual currencies is uncertain. The identity of virtual currency market participants may be opaque, which may increase the risk of market manipulation and fraud. Fees involved in trading virtual currencies may vary.


.png)