
As usual for our December factor performance reports, the majority of this piece will be spent discussing full-year factor performance. With that being said, below we share performance for the month of December only. Worth highlighting are the excellent returns of our Equity, Interest Rates, and Credit factors as the Fed held steady and signaled more rate cuts in 2024 than they previously indicated.
Exhibit 1: Two Sigma Factor Lens Performance in December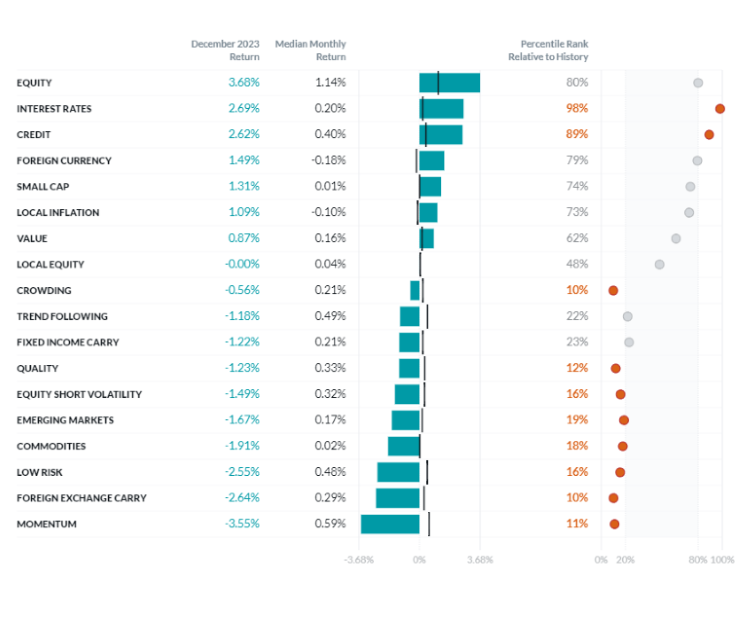
Source: Venn by Two Sigma. The median and percentile columns measure the performance of each factor in the Two Sigma Factor Lens relative to the entire history of the factor in USD, using monthly data for the period October 1997 - December 2023
Exhibit 2: Two Sigma Factor Lens Performance in 2023
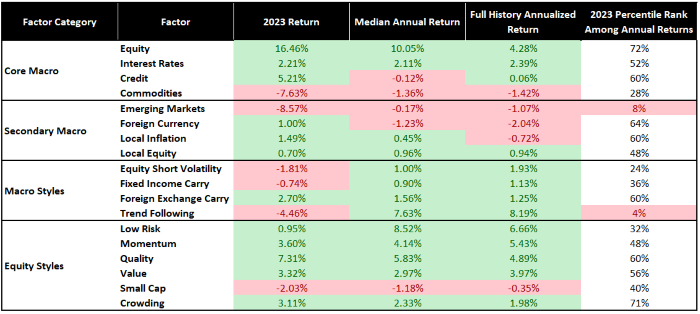
Source: Venn by Two Sigma as of 12/29/2023, using data from October 3, 1997 - December 29, 2023
Macro Factors: In 2023, we saw our Equity factor up 16.46% (after accounting for the risk free rate). Other core macro factors, such as Interest Rates and Credit, were also positive, rallying to end the year. Among core macro, only Commodities experienced negative returns in 2023.
A quick shoutout to the Credit factor, which has been trending upward since July. A decrease in perceived corporate default risk, after accounting for moves in both Equity and Interest Rates factors, has no doubt been welcomed by markets.
Among secondary macro factors, the U.S. dollar depreciated relative to foreign currencies (Foreign Currency) and it paid to have U.S equity home bias (Local Equity). Those who implemented a U.S hedge for inflation, beyond that found in core macro factors were rewarded for it (Local Inflation).
The Emerging Markets factor was… tough to watch.
Style Factors: Within macro style factors, Trend Following struggled in 2023 where themes such as “higher for longer” and “more cuts than expected” were making headlines just a few months apart. Our systematic carry factors worked in foreign exchange but not fixed income markets. And after residualizing with our Equity factor, short volatility holders came out behind.
Five out of six equity style factors were positive, making it a good year for those with exposure to these systematic drivers of alpha within equity markets. Only Small Cap posted negative returns, which is consistent with long-term performance as well.
Putting 2023 Performance into Context
While not many factors had notable annual performance, Emerging Markets and Trend Following did, falling into the bottom 8th and 4th percentile respectively of their historical annual returns since 1998. Emerging Markets was particularly notable, as its raw input was actually up over 8% in 2023. However, once its exposure to higher tier factors such as Equity, Interest Rates, Credit, Commodities is accounted for, a pure exposure to Emerging Markets was not rewarded.
Among equity styles, the percentile rank of Crowding’s 2023 return was highest at 71%. This means it was a relatively good year to short the most heavily shorted stocks in the U.S.
Shifting gears, let’s dive more into the combination of 2022 and 2023, a tale that begins with the return of inflation.
A Tale of Two Years
The Fed (and other central banks) fought inflation over both 2022 and 2023, leading to their most aggressive hiking cycle in four decades. However, despite common themes, context between the two years was quite different.
For example, using U.S. YoY CPI in Exhibit 3, we show how peak inflation was reached in 2022 alongside aggressive rate hikes. 2023 however, could be characterized by falling inflation and relatively fewer and smaller hikes.
Exhibit 3: Headline U.S. YoY CPI and Fed Rate Hikes
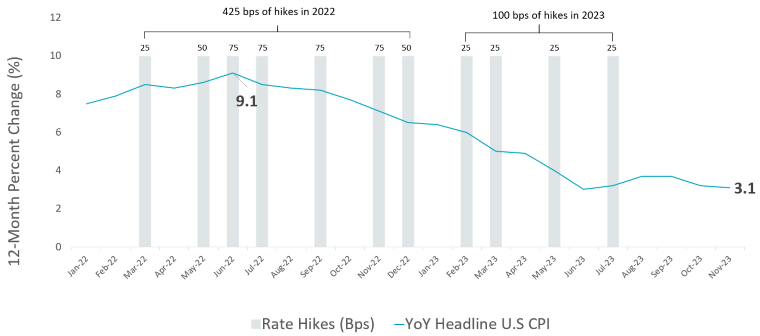
Source: Venn by Two Sigma and the Bureau of Labor Statistics as of 12/29/2023
In Exhibit 4 below, we look at the calendar year performance of the Two Sigma Factor Lens in 2022 and 2023. For example, our Equity factor went from around -17% in 2022 to up over 16% in 2023, and our Interest Rates factor went from its worst annual return in history in 2022, to a positive return in 2023.
Exhibit 4: Two Sigma Factor Lens Performance, 2022 vs. 2023
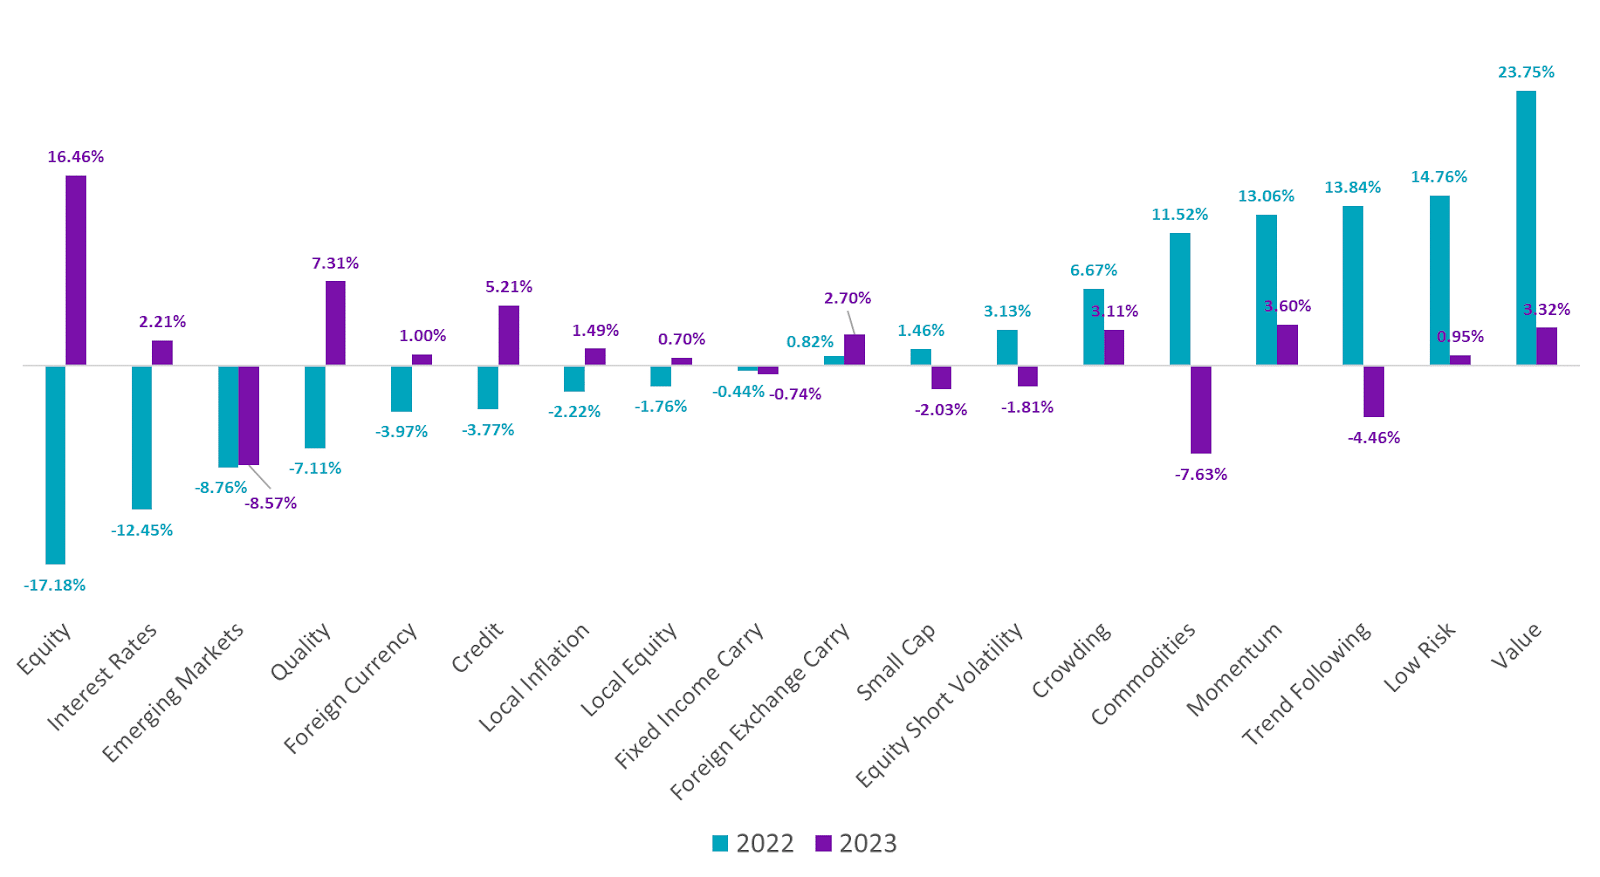
Source: Venn by Two Sigma as of 12/29/2023
Emerging Markets was among the only factors that was deeply negative in both years, in part due to continued weakness from China, a dominant contributor to Emerging Market performance generally.
2023: A Thrilling Tale with a Happy Ending
Despite improved returns from Equity and Interest Rates, 2023 wasn’t all smooth sailing. It began with a U.S. regional banking crisis that, despite subsiding, still led to meaningful underperformance for that segment of the market. This, for example, acted as a drag on our Value factor, but it benefited Quality.
Around late summer to early fall, the theme “higher for longer” also took hold of market headlines, reigniting 2022 performance themes. More specifically, equity and bonds experienced meaningful drawdowns in tandem (Exhibit 5).
Exhibit 5: Equity and Interest Rates Factor’s Cumulative Return in 2023
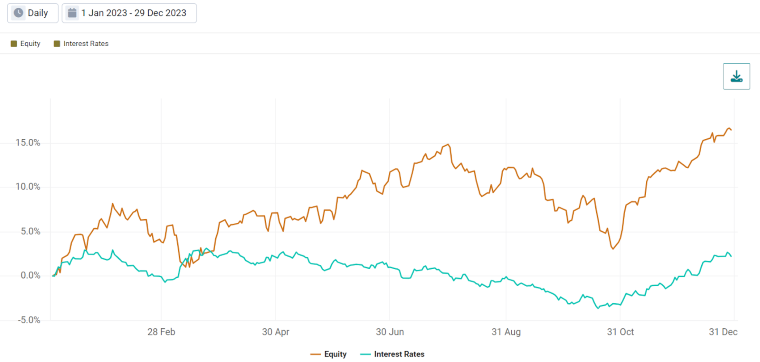
Source: Venn by Two Sigma as of 12/29/2023
Exhibit 5 also shows how downward trending markets reversed course around the end of October. Per Reuters, “investors increased bets that the Federal Reserve's tightening cycle is over after signs of cooling inflation and job growth and a better-than-expected third-quarter earnings season.”
This sentiment, along with Fed validation in December, led to a fantastic rally in our Equity, Interest Rates, and Credit factors to close out the year (Exhibit 6). Additionally, the USD fell 4.91% over this period on lower rate hike expectations. This benefited our Foreign Currency factor which is short the USD, and hurt our Foreign Exchange Carry factor which was long the USD.
Exhibit 6: End of Year Rally in Equity, Interest Rates, and Credit
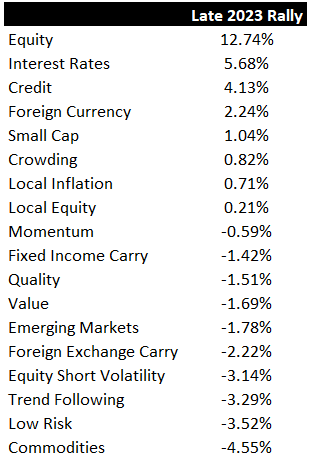
Source: Venn by Two Sigma. Period measures from 10/27/2023 – 12/29/2023. Start date was chosen based on a reversal of trend in our Equity factor.
On to the Next Chapter
Despite some bumps along the way, 2023 ended up in a much different place than 2022.
No factors had historically significant positive performance for the year, though few are complaining about a near 17% equity risk premium. This includes a positive return from the bond risk premium, avoiding three straight calendar year losses. In terms of historically negative performance, only Trend Following and Emerging Markets notably struggled.
While we can close the chapter on 2023, as always, a new chapter begins in markets. But due to the arbitrary nature of calendar year-ends, generally speaking, we can call this one a happy ending.
As always, we will continue to post factor performance reports at the beginning of each month. Please subscribe if you’d like to keep those on your radar.
Happy New Year!
References
1 https://www.cnbc.com/2023/12/13/fed-interest-rate-decision-december-2023.html
2 Venn utilizes residualization to decorrelate overlapping risks in our lens. We do not always caveat each factor by listing out the factors it is residualized against, so we encourage you to read our blog on residualization for more information.
3 Subjectively considered to be top or bottom 20th percentile of historical annual returns.
4 Despite a reasonable case for a premium, empirical evidence suggests that Emerging Markets has not been a rewarded factor over the long term after accounting for the mentioned overlapping risks. This is also shown by the negative return in Exhibit 2 for “Full History Annualized Returns”
6 For example, the SPDR S&P Regional Banking ETF was down -7.7% in 2023.
9 Source: DXY index from MarketWatch
References to the Two Sigma Factor Lens and other Venn methodologies are qualified in their entirety by the applicable documentation on Venn.
This article is not an endorsement by Two Sigma Investor Solutions, LP or any of its affiliates (collectively, “Two Sigma”) of the topics discussed. The views expressed above reflect those of the authors and are not necessarily the views of Two Sigma. This article (i) is only for informational and educational purposes, (ii) is not intended to provide, and should not be relied upon, for investment, accounting, legal or tax advice, and (iii) is not a recommendation as to any portfolio, allocation, strategy or investment. This article is not an offer to sell or the solicitation of an offer to buy any securities or other instruments. This article is current as of the date of issuance (or any earlier date as referenced herein) and is subject to change without notice. The analytics or other services available on Venn change frequently and the content of this article should be expected to become outdated and less accurate over time. Two Sigma has no obligation to update the article nor does Two Sigma make any express or implied warranties or representations as to its completeness or accuracy. This material uses some trademarks owned by entities other than Two Sigma purely for identification and comment as fair nominative use. That use does not imply any association with or endorsement of the other company by Two Sigma, or vice versa. See the end of the document for other important disclaimers and disclosures. Click here for other important disclaimers and disclosures.