
Return-based analysis provides valuable investment insights using only investment returns. It is important to acknowledge that holdings can provide additional layers of context for managers or portfolios. In a recent article we showed an example of this, analyzing an individual manager with returns-based factor analysis alongside their holdings.
A popular holdings category that investors refer to is equity sectors, perhaps due to a variety of reasons including their appearance on fact sheets, popularity in mainstream media, or their use as tools to express views on markets. This broad familiarity is one reason Venn provides access to equity sector breakdowns in its new holdings blocks within both its Studio and Report Lab features.
To better understand the exposure associated with equity sectors, we conducted returns-based factor analysis on each global Morningstar sector return stream. We think this analysis may help provide investors with an intuitive reference point when analyzing factor exposures and equity sector holdings data side by side.
Given the Morningstar indexes are long-only equities, one would expect the Equity Factor to be the dominant exposure shared across sectors. For this reason, we focused on analysis relative to the global market, which helps control for Equity exposure and highlight each sector's unique active bets instead.1
Below we summarize Venn’s results over more than two decades of data, highlighting the top (green) and bottom (red) two relative factor exposures (most positive and negative ß) for each sector versus the global equity market.2 For more information on each sector classification, please see the appendix. (Tip: you can click on the table to enlarge it.)
Global Morningstar Sector Active Exposure (ß) Relative to MSCI ACWI
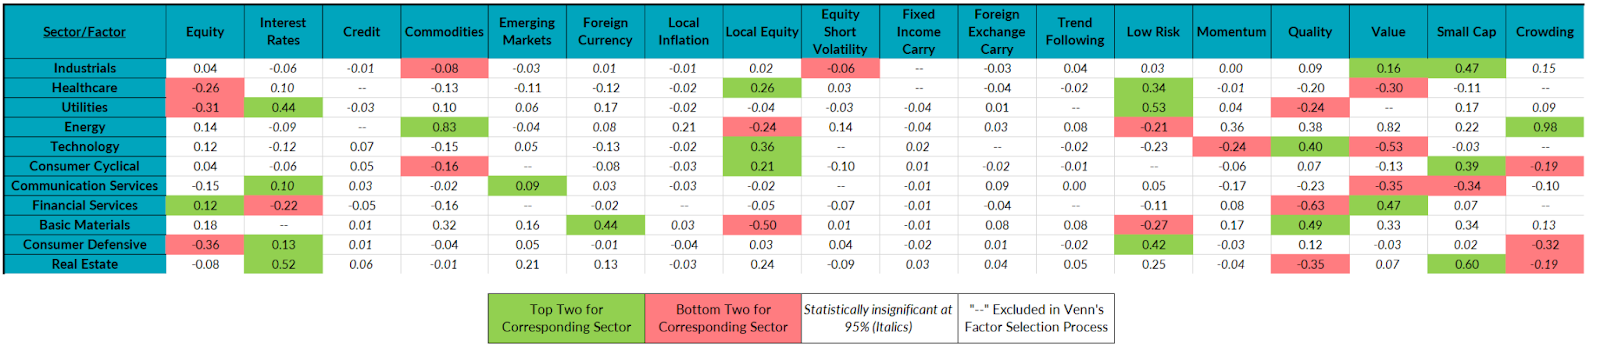
Source: Venn by Two Sigma and Morningstar. Period analyzed from Dec 5, 2001–May 22, 2023. See here for more information on our factor selection process.
Top and Bottom Two Active Factor Bets of Different Equity Sectors
Of our 18 risk factors, 11 unique factors were found in the top and bottom two active bets for each sector. Of these 11, Equity, Commodities, Interest Rates, Foreign Currency, and Local Equity are macro factors, whereas Low Risk, Small Cap, Quality, Value, and Crowding are equity style factors. Equity Short Volatility is a macro style factor.
Equity: Healthcare, Utilities, and Consumer Defensive, exhibited negative relative equity exposure in their bottom two, with only Financials having positive equity exposure in its top two. For the sectors with relatively less Equity exposure this means that these sectors all exhibited less sensitivity to long-term economic growth than the broad equity market. This might be interpreted as relative defensiveness to economic downturns or periods when equity markets are negative. For example, over the same period of our analysis, each index’s downside capture to MSCI ACWI was 74.22%, 65.48%, and 61.17% respectively.
Commodities: Energy exhibited a positive bet on our Commodity factor in its top two factor exposures. Although Basic Materials had stronger positive exposures elsewhere, it also had meaningful positive sensitivity to movements in our Commodity factor. This is intuitive as both sectors directly or indirectly have exposure to things such as oil, gas, and commodity exploration and processing.
Industrials and Consumer Cyclical both had negative commodities bets versus the benchmark in their bottom two factor exposures. This is a comment not only on the lack of or negative commodity exposure for these sectors, but also the positive commodity exposure that exists in the global equity market when viewed by itself. In other words, if our Commodity factor performs positively, you might expect these sectors to experience negative performance relative to the market attributable to this dynamic.
Interest Rates: Our Interest Rates Factor represents a long global bond exposure. Referring to the table above, this means that Utilities, Communication Services, Consumer Defensive, and Real Estate are expected to outperform the broad market when rates fall, or global bonds are expected to do well (though Communication Services' exposure specifically was not statistically significant). Utilities and Real Estate, which exhibited very strong positive active exposure to this factor may benefit from falling rates due to a lower cost to borrow and their tendency to carry higher levels of debt.
Financials exhibited negative relative exposure to Interest Rates in its bottom two factor exposures, indicating that its relative performance might be hurt by falling interest rates. Put another way, the Financial sector typically benefits from rising rates versus the broad market as it collects more income from borrowers.
Foreign Currency/Local Equity: Only Basic Materials exhibited a positive Foreign Currency bet in its top two relative exposures. This may be partly explained by more meaningful international stock exposure than the global equity market. For example, as of the end of April 2023, the basic materials index had roughly 74.48% weight in non-U.S. stocks while MSCI ACWI had 39.48%.3
Unsurprisingly, Basic Materials also exhibited a relative negative Local Equity exposure, implying an international bias. This was also true for the Energy sector index. It is worth noting that the Energy sector also exhibited a positive Foreign Currency bet relative to global equity markets. Negative Local Equity and positive Foreign Currency exposures often go hand in hand (but not always).
Unlike Basic Materials and Energy, Technology exhibited a strong bias to the U.S. market relative to MSCI ACWI. For example, if international stocks outperform U.S. stocks, we would expect these dynamics to benefit Basic Materials' and Energy's relative performance but detract from Technology’s.
Low Risk: All of the sectors that exhibited a lower exposure to our Equity Factor also exhibited a higher exposure to our Low Risk Factor (Healthcare, Utilities, and Consumer Defensive). This implies that these sectors are overweight lower risk stocks and may benefit when those stocks outperform higher risk stocks.
Sectors with relative high risk equity bets in their bottom two factor exposures were Energy and Basic Materials.
Small Cap: Industrials,4 Consumer Cyclical and Real Estate all exhibited relative Small Cap exposure to the global market. Especially in the case of Consumer Cyclical, Small Cap exposure may be expected given that smaller companies are often thought to be more sensitive to economic cycles.
Versus the global equity market, Communication Services exhibited a bias toward large cap companies in its bottom two factor exposures.
Quality: Technology and Basic Materials exhibited positive Quality exposure, implying these sectors may behave in line with companies with strong balance sheets relative to “junkier” stocks.
On the other hand, Utilities, Financial Services, and Real Estate were associated with negative relative Quality, suggesting their relative performance may benefit from junk equity rallies.
Value: Five of the eleven sectors had relative Value exposure in their top or bottom two factor exposures versus the broader market. Financials and Industrials exhibited a positive bet. Healthcare, Technology, and Communication Services a negative one. In the Two Sigma Factor Lens, negative exposure to Value can be thought of as a proxy for growth, implying the latter three sectors are more growth-oriented than the broad market.
Crowding: This factor captures the premium from shorting heavily shorted U.S stocks versus going long those that are not heavily shorted. In the long-only space relative to a benchmark, a positive beta implies an overweight to stocks not heavily shorted, while a negative beta implies an overweight to stocks that are heavily shorted.
As a result, analysis from our table suggests that Consumer Defensive has tended to be more exposed to stocks held short than the broad market, while Energy tends to have an overweight to those stocks not heavily shorted. In the cases of Consumer Cyclical and Real Estate, Crowding exposure was not statistically significant despite being in the bottom two.
Equity Short Volatility: Only Industrials had Equity Short Volatility in its top or bottom two factor exposures, but it was not statistically significant.
What Do These Relationships Mean for Investors?
While undoubtedly there exists unaccounted for systematic risks related to specific sector betas, our analysis shows how other risk factors can be found in the active bets of sectors, such as Commodities within Energy, or Quality within Technology. It is worth noting we could conduct this analysis with other categories, such as countries or regions, as well. This is a good demonstration of the value of factor analysis generally, looking past holdings labels such as sectors and instead leveraging independent risk factors to uncover exposures.
We believe having a reference point for how sector bets translate to factor bets may help drive intuition when evaluating portfolios or managers. To be clear, holistic factor analysis that includes sector or country factors may be a more direct way to measure drivers of risk and return, but there may also be value in understanding that typical Utilities sector exposure may represent an active bet on Interest Rates, or that Basic Materials may represent an active bet on Foreign Currencies. Ultimately, considering these relationships between returns-based factor analysis and familiar holdings categories may lead to a deeper understanding of asset allocation and manager selection.
Appendix: Sector Classification Details
Source: Morningstar
Basic Materials: Companies that manufacture chemicals, building materials, and paper products. This sector also includes companies engaged in commodities exploration and processing. Companies in this sector include ArcelorMittal, BHP Billiton, and Rio Tinto.
Communication Services: Companies that provide communication services using fixed-line networks or those that provide wireless access and services. Also includes companies that provide advertising & marketing services, entertainment content and services, as well as interactive media and content providers over internet or through software. Companies in this sector include AT&T, Verizon Communications, Walt Disney, Netflix, Omnicom Group, Alphabet and Facebook.
Consumer Cyclical: This sector includes retail stores, auto and auto-parts manufacturers, restaurants, lodging facilities, specialty retail and travel companies. Companies in this sector include Ford Motor Co., McDonald’s, and Amazon.com Inc.
Consumer Defensive: Companies that manufacture food, beverages, household and personal products, packaging, or tobacco. Also includes companies that provide services such as education and training services. Companies in this sector include Philip Morris International, Procter & Gamble, and Walmart.
Energy: Companies that produce or refine oil and gas, oilfield-services and equipment companies, and pipeline operators. This sector also includes companies that mine thermal coal and uranium. Companies in this sector include BP, ExxonMobil, Royal Dutch Shell, and China Shenhua Energy.
Financial Services: Companies that provide financial services include banks, savings and loans, asset management companies, credit services, investment brokerage firms, and insurance companies. Companies in this sector include Allianz, JPMorgan Chase, and Legg Mason.
Healthcare: This sector includes biotechnology, pharmaceuticals, research services, home healthcare, hospitals, long-term-care facilities, and medical equipment and supplies. Also include pharmaceutical retailers and companies which provide health information services. Companies in this sector include AstraZeneca, Pfizer, and Roche Holding, Walgreens Boots Alliance, and Cerner Corp.
Industrials: Companies that manufacture machinery, hand-held tools, and industrial products. This sector also includes aerospace and defense firms as well as companies engaged in transportation services. Companies in this sector include 3M, Boeing, and Siemens.
Real Estate: This sector includes companies that develop, acquire, manage, and operate real estate properties. Companies in this sector include Kimco Realty, Vornado Realty Trust, and Westfield Group.
Technology: Companies engaged in the design, development, and support of computer operating systems and applications. This sector also includes companies that make computer equipment, data storage products, networking products, semiconductors, and components. Companies in this sector include Apple, Microsoft, and IBM.
Utilities: Electric, gas, and water utilities. Companies in this sector include Electricité de France, Exelon and NextEra Energy Inc.
References
1 As part of Venn’s parsimoniouss nature, it does not include sector-based factors in its factor model. As a result, risk and return driven by a systematic risk specific to each sector category would be attributed to residual in our model. For example, from Dec 2001–May 2023 the median residual risk contribution (unexplained risk) for each sector vs. the global equity market was 53.95% with a minimum of 24.07% (Consumer Defensive) and a maximum of 77.72% (Communication Services). It may be the case that a meaningful amount of unexplained active risk is driven by a sector beta not captured by Venn. It is also worth noting that the Two Sigma Factor lens incorporates techniques such as volatility scaling, which should help make factor betas more comparable across the different factors
2 Represented by the MSCI ACWI index.
3 Morningstar website index information and MSCI ACWI fact sheet.
4 The Small Cap exposure of this sector may be a little less intuitive, so it is worth noting as of the end of April 2023, 62% of its weight was in large cap securities with 30% in mid cap and 8% in small cap by Morningstar classification. Source: Morningstar website index information. Part of its relative small cap exposure may be due to not holding many of the largest names in the market, for example companies like Apple, Microsoft or Amazon.
This article is not an endorsement by Two Sigma Investor Solutions, LP or any of its affiliates (collectively, “Two Sigma”) of the topics discussed. The views expressed above reflect those of the authors and are not necessarily the views of Two Sigma. This article (i) is only for informational and educational purposes, (ii) is not intended to provide, and should not be relied upon, for investment, accounting, legal or tax advice, and (iii) is not a recommendation as to any portfolio, allocation, strategy or investment. This article is not an offer to sell or the solicitation of an offer to buy any securities or other instruments. This article is current as of the date of issuance (or any earlier date as referenced herein) and is subject to change without notice. The analytics or other services available on Venn change frequently and the content of this article should be expected to become outdated and less accurate over time. Any statements regarding planned or future development efforts for our existing or new products or services are not intended to be a promise or guarantee of future availability of products, services, or features. Such statements merely reflect our current plans. They are not intended to indicate when or how particular features will be offered or at what price. These planned or future development efforts may change without notice. Two Sigma has no obligation to update the article nor does Two Sigma make any express or implied warranties or representations as to its completeness or accuracy. This material uses some trademarks owned by entities other than Two Sigma purely for identification and comment as fair nominative use. That use does not imply any association with or endorsement of the other company by Two Sigma, or vice versa. See the end of the document for other important disclaimers and disclosures. Click here for other important disclaimers and disclosures.
This article may include discussion of investing in virtual currencies. You should be aware that virtual currencies can have unique characteristics from other securities, securities transactions and financial transactions. Virtual currencies prices may be volatile, they may be difficult to price and their liquidity may be dispersed. Virtual currencies may be subject to certain cybersecurity and technology risks. Various intermediaries in the virtual currency markets may be unregulated, and the general regulatory landscape for virtual currencies is uncertain. The identity of virtual currency market participants may be opaque, which may increase the risk of market manipulation and fraud. Fees involved in trading virtual currencies may vary.