
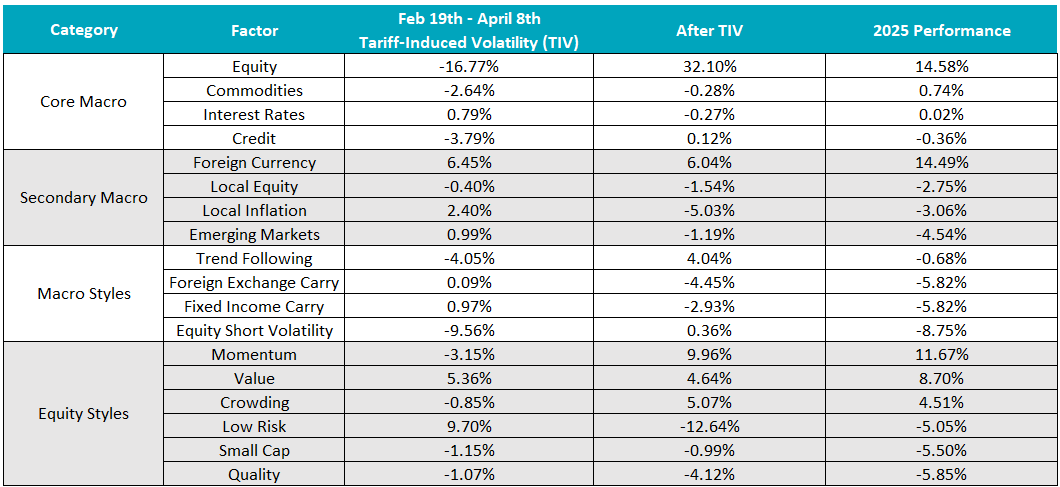
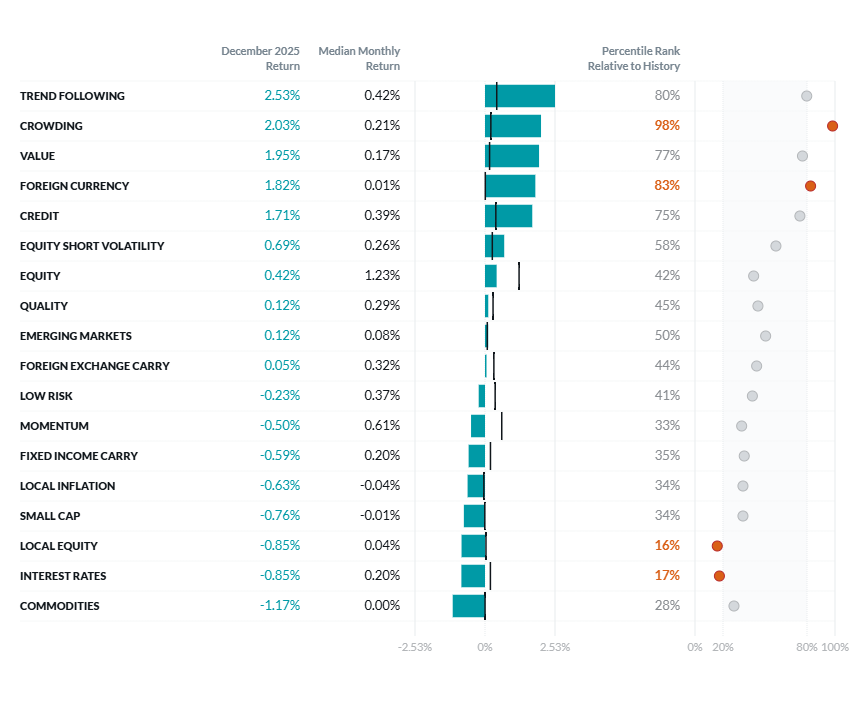
Exhibit 1: Two Sigma Factor Lens Performance in 2025
©2025 Two Sigma Investments, LP. This image is for informational purposes only. See https://www.venn.twosigma.com/blog-disclaimer for more disclaimers and disclosures.
Source: Venn by Two Sigma. The median and percentile columns measure the performance of each factor in the Two Sigma Factor Lens relative to the entire history of the factor in USD, using monthly data for the period August 1998 - December 2025.
The Two Sigma Factor Lens is designed to capture independent and fundamental risks that are commonly found in institutional portfolios. The factor returns we report here represent what happened in markets, but how much they affected any given portfolio depends on that portfolio's exposure. A 10% drawdown in a factor matters little if your exposure is minimal; it matters a great deal if it's concentrated.
For more on how each factor is constructed to be independent from higher-tier factors, see “How to Identify Independent Sources of Risk for Multi-Asset Managers and Portfolios” (i.e., what each factor is residualized against).
Core Macro
Equity: Tariffs were expected to harm U.S. growth, which makes up more than 60% of market-cap-weighted global equity markets.2 It was believed that they would cause inflation and squeeze margins of the U.S. businesses responsible for paying them. What’s more, higher inflation would delay expected Fed rate cuts. By Liberation Day (April 2nd) these fears had already been building for weeks, with the day itself acting as the final straw.
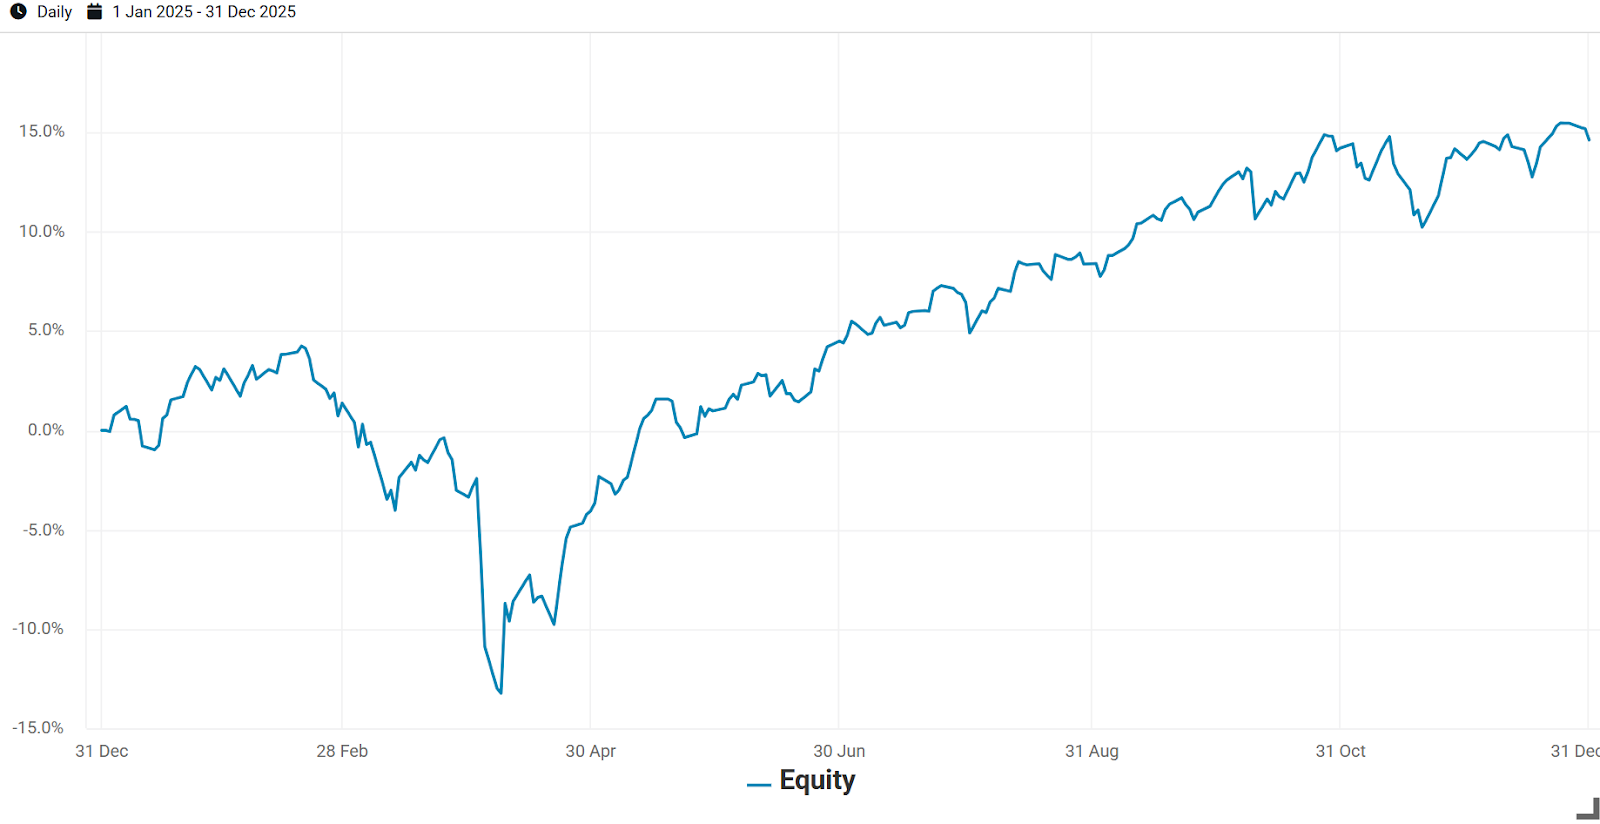
Exhibit 2 shows that once markets had digested LD, a recovery began. U.S. Inflation reports continued to be lower than expected, earnings were robust, and despite a government shutdown, the Fed cut rates in-line with expectations. At least in 2025, the 14.58% performance of our Equity factor suggests that the negative impact of tariffs was overblown compared to expectations.
Exhibit 2: Equity Factor Performance in 2025
 Source: Venn by Two Sigma.
Secondary Macro
Foreign Currency: In our USD lens, this factor seeks to capture appreciation of G10 currencies versus the USD, due only to exchange rate dynamics.
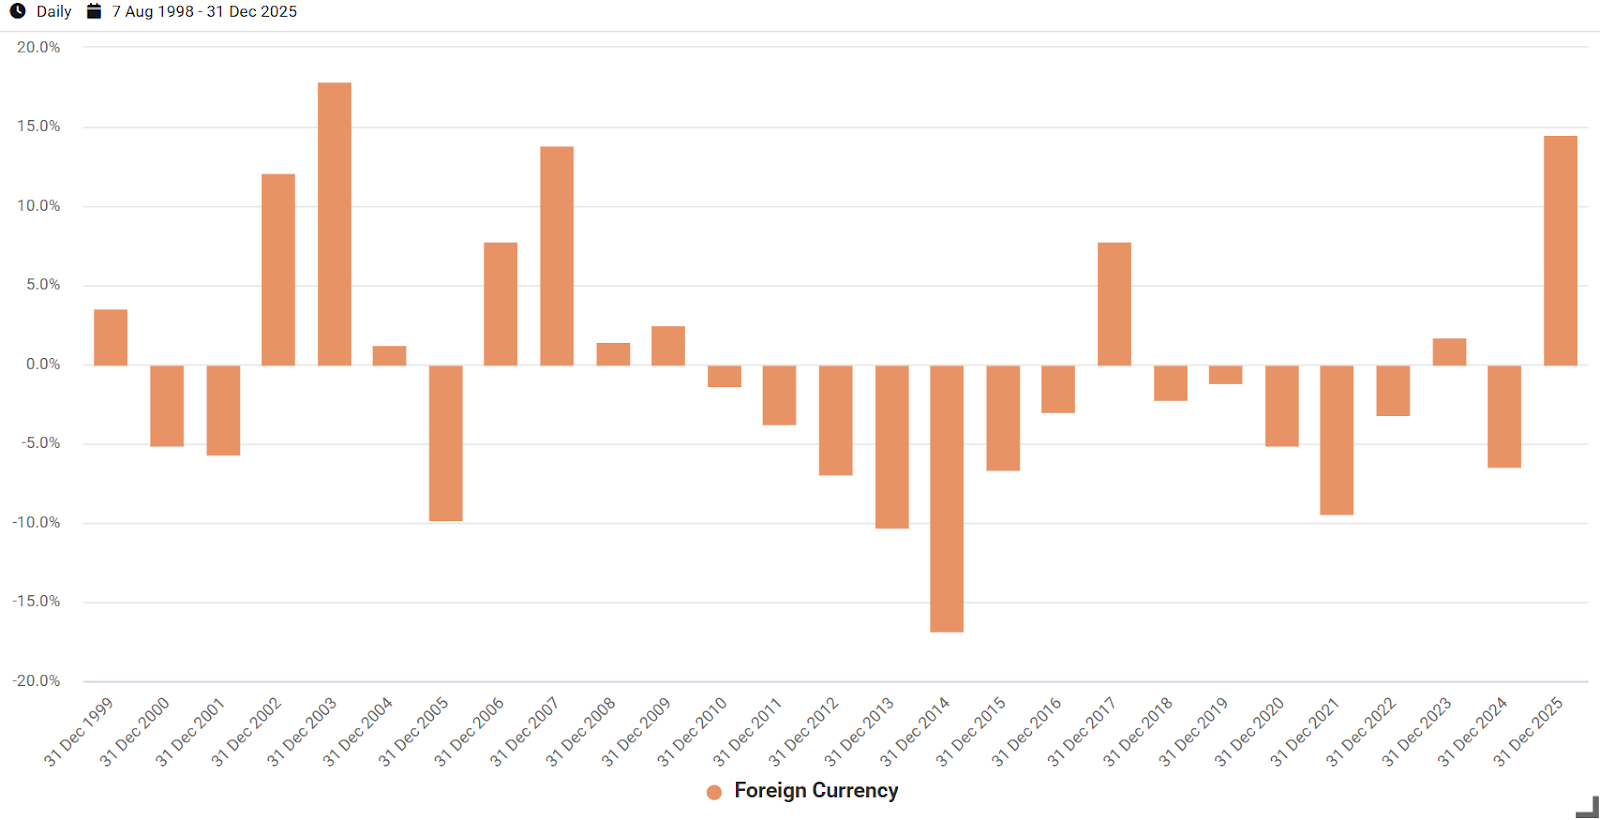
Given the significant period of TIV we discussed, it’s fair to say that tariffs introduced some chaos into markets, stoking trade war fears and creating inflation and growth concerns. This resulted in a significant sell-off of the USD and perhaps some doubt in its role as a safe-haven asset. As we can see in Exhibit 3, this was one of the strongest years in the history of Venn’s Foreign Currency factor, up 14.49%.
Exhibit 3: Calendar Year Returns of Venn’s Foreign Currency Factor
 Source: Venn by Two Sigma.
For US investors with meaningful exposure to foreign currencies, this translates into tailwinds. For example, the iShares MSCI EAFE ETF (EFA) outperformed its hedged counterpart (HEFA) by 8.1% in 2025.
Local Inflation: This factor captures the value of a pure inflation hedge. In normal times, it’s expected to be negative as it’s short the inflation risk premium. It “pays off” when pure inflation is higher than expected, and the value of the hedge outweighs the cost to implement it.
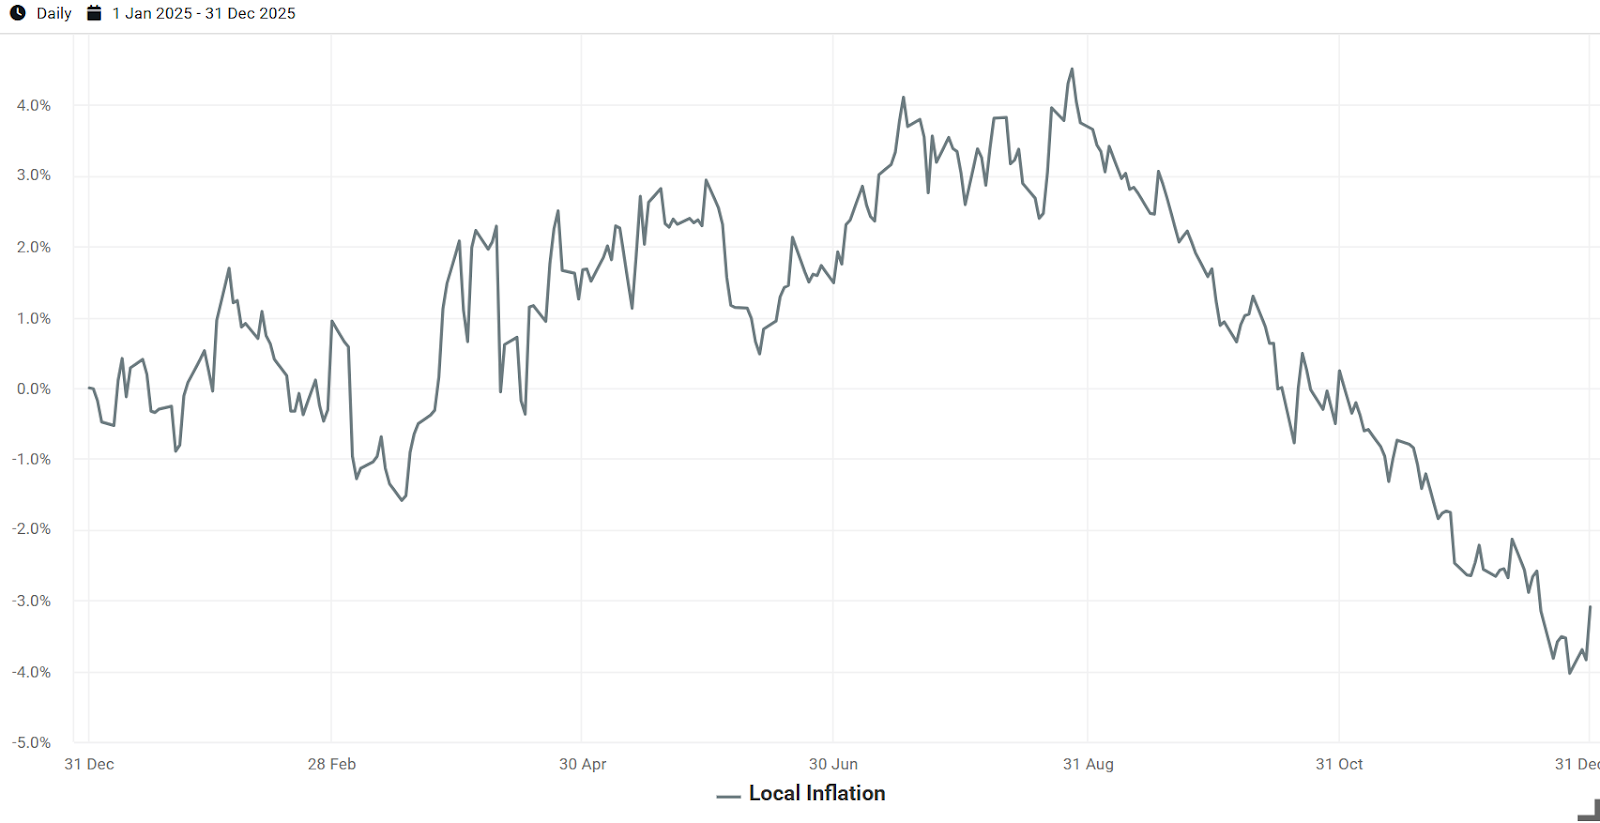
This factor's performance captured inflation dynamics beyond our core macro factors throughout the year. In the first half, tariff fears elevated pure inflation expectations, and an inflation hedge added value, so the factor was volatile but generally positive.
As H2 data consistently showed tariffs weren't feeding through to prices, expectations normalized. The cost of holding an inflation hedge began to outweigh its value, and the factor fell sharply starting around September.
Exhibit 4: Local Inflation Factor Performance in 2025
Source: Venn by Two Sigma.
Macro Styles
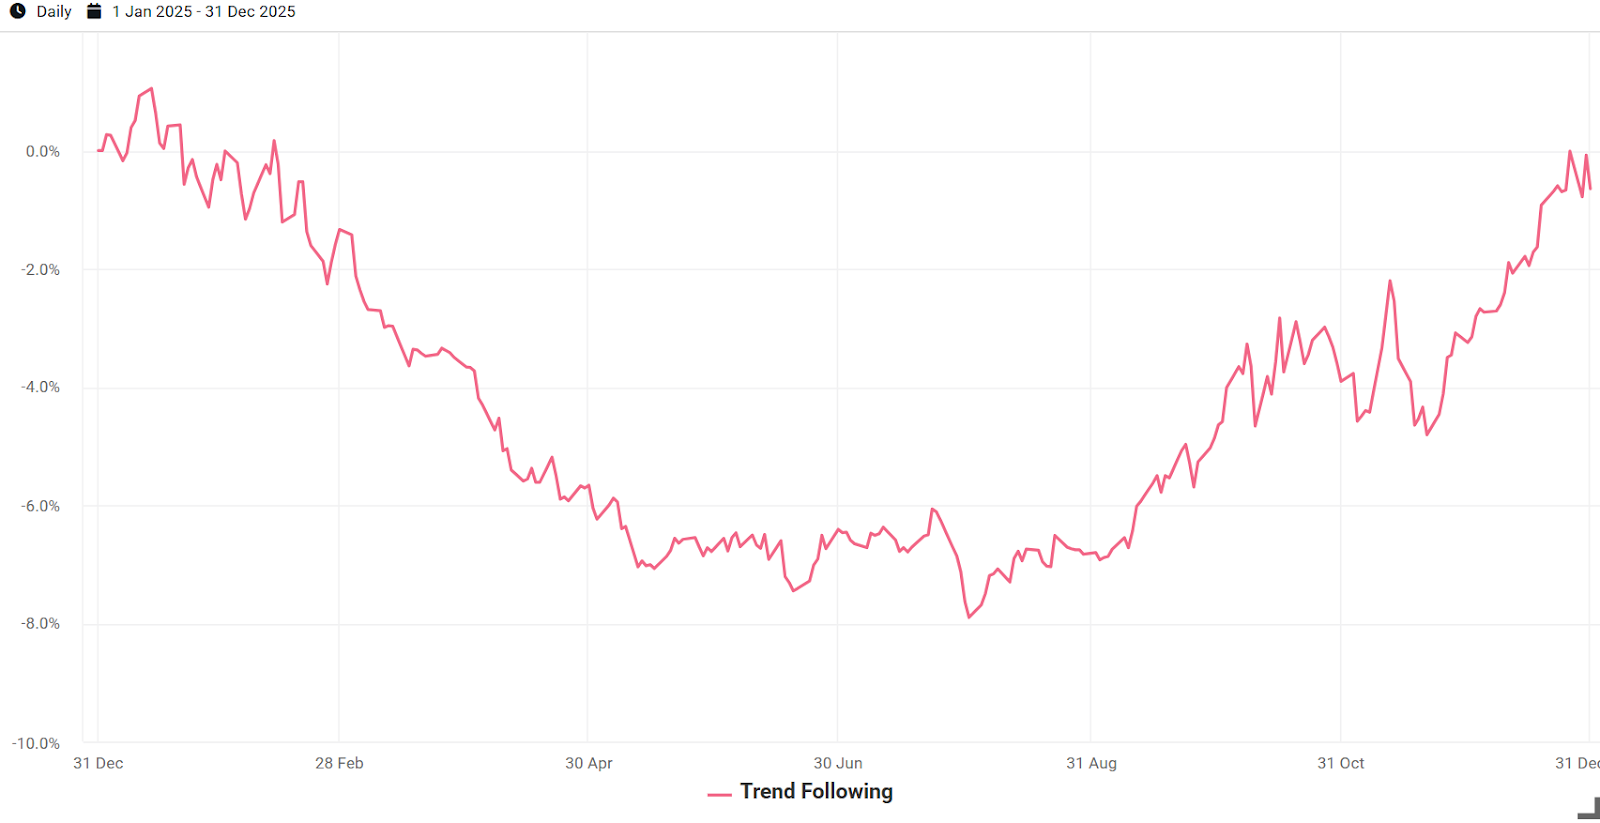
Trend Following: This factor goes long or short futures across equities, fixed income, commodities, and currencies, based on their performance trends relative to their own history.
Trend Following came into the year struggling to identify and benefit from broad market trends. Through July, it was down almost 8%. As markets stabilized and a clear “it's not as bad as we thought” theme emerged, the factor was able to reposition. It benefited particularly from equity and commodity futures trends, recovering some earlier losses.
Some might wonder why it didn't stabilize closer to LD in early April. Trend strategies need time to reposition. Our factor uses industry-standard 6- to 12-month windows to measure performance trends, so it takes months for new trends to surface, and longer still for them to drive meaningful positioning changes.
Exhibit 5: Trend Following Factor Performance in 2025
 Source: Venn by Two Sigma.
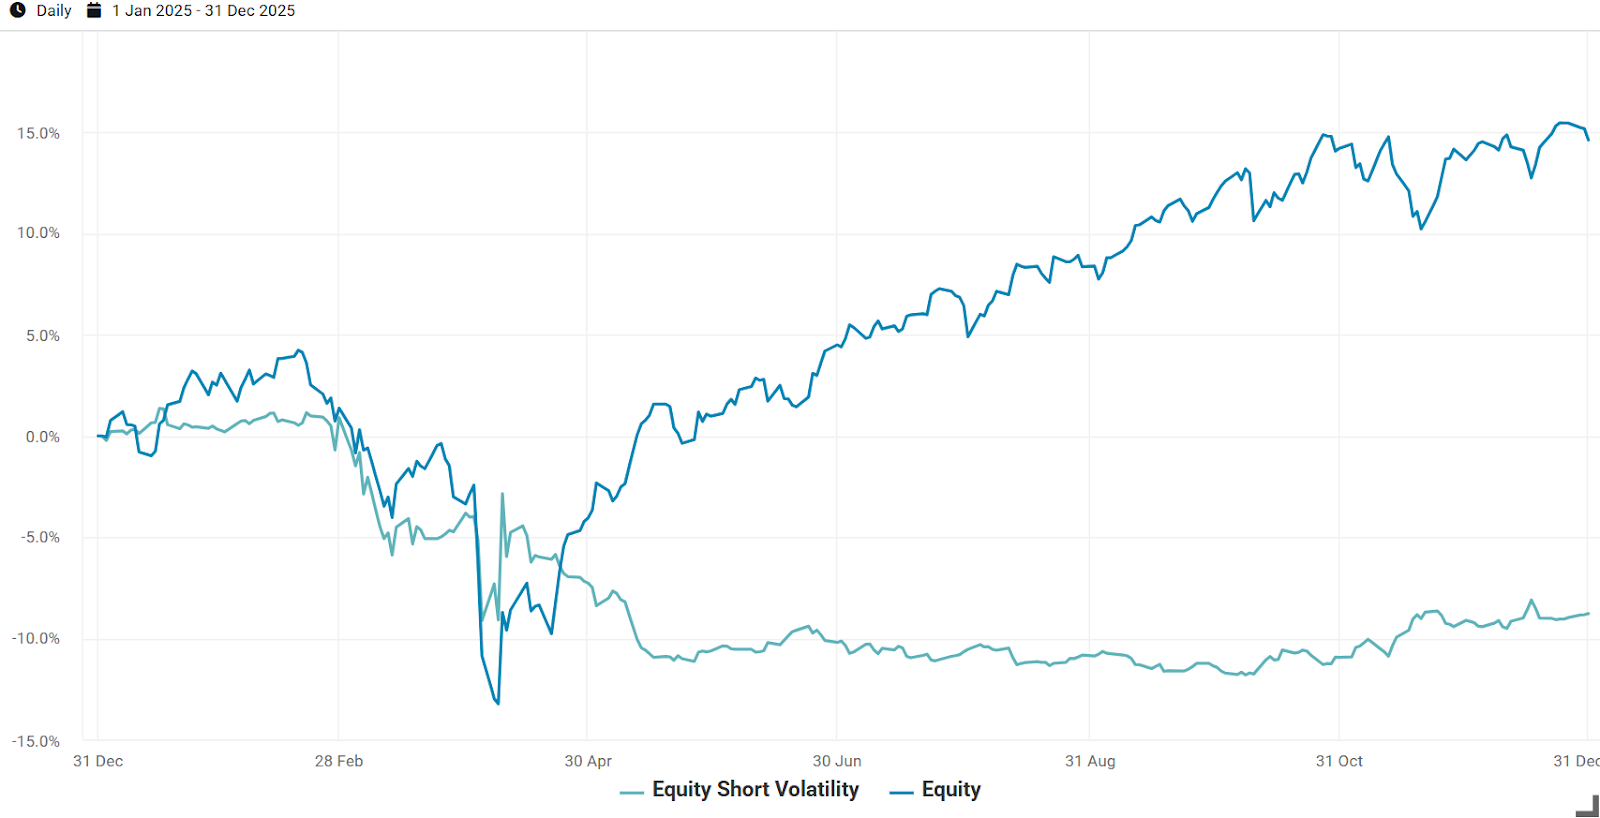
Equity Short Volatility: Despite its name, this factor captures volatility beyond what is captured in Equity market movements. In normal times, it is expected to benefit from the premiums of providing others with volatility insurance. It’s expected to be negative when volatility is higher than expected and that insurance needs to pay out.
Exhibit 6 makes clear how directly tariffs impacted this factor. It dropped steeply when TIV began and kept falling past April 8th, even as our Equity factor started recovering.
Because it is residualized against our Equity factor, it seeks to capture the volatility insurance premium independent of equity market direction. Its muted recovery suggests that even as equities rallied, excess volatility remained elevated.
Exhibit 6: Equity Short Volatility and Equity Factor Performance in 2025
Equity Styles
Low Risk, Momentum, Crowding: Low Risk and Momentum represent global market neutral and long/short portfolios. Low Risk captures the excess return from stocks that have had relatively lower risk, and Momentum captures the excess return from stocks that have been performing relatively better.
Crowding is a little unique. It is U.S.-only, and is expected to be positive when shorted stocks underperform less-shorted stocks. In other words, when a short interest signal is a reliable way to generate relative alpha. With that said, it uses residual short interest, attempting to capture the sentiment of sophisticated investors, but differentiated from other equity styles that also take short positions.
Exhibit 7: Equity Style Performance in 2025
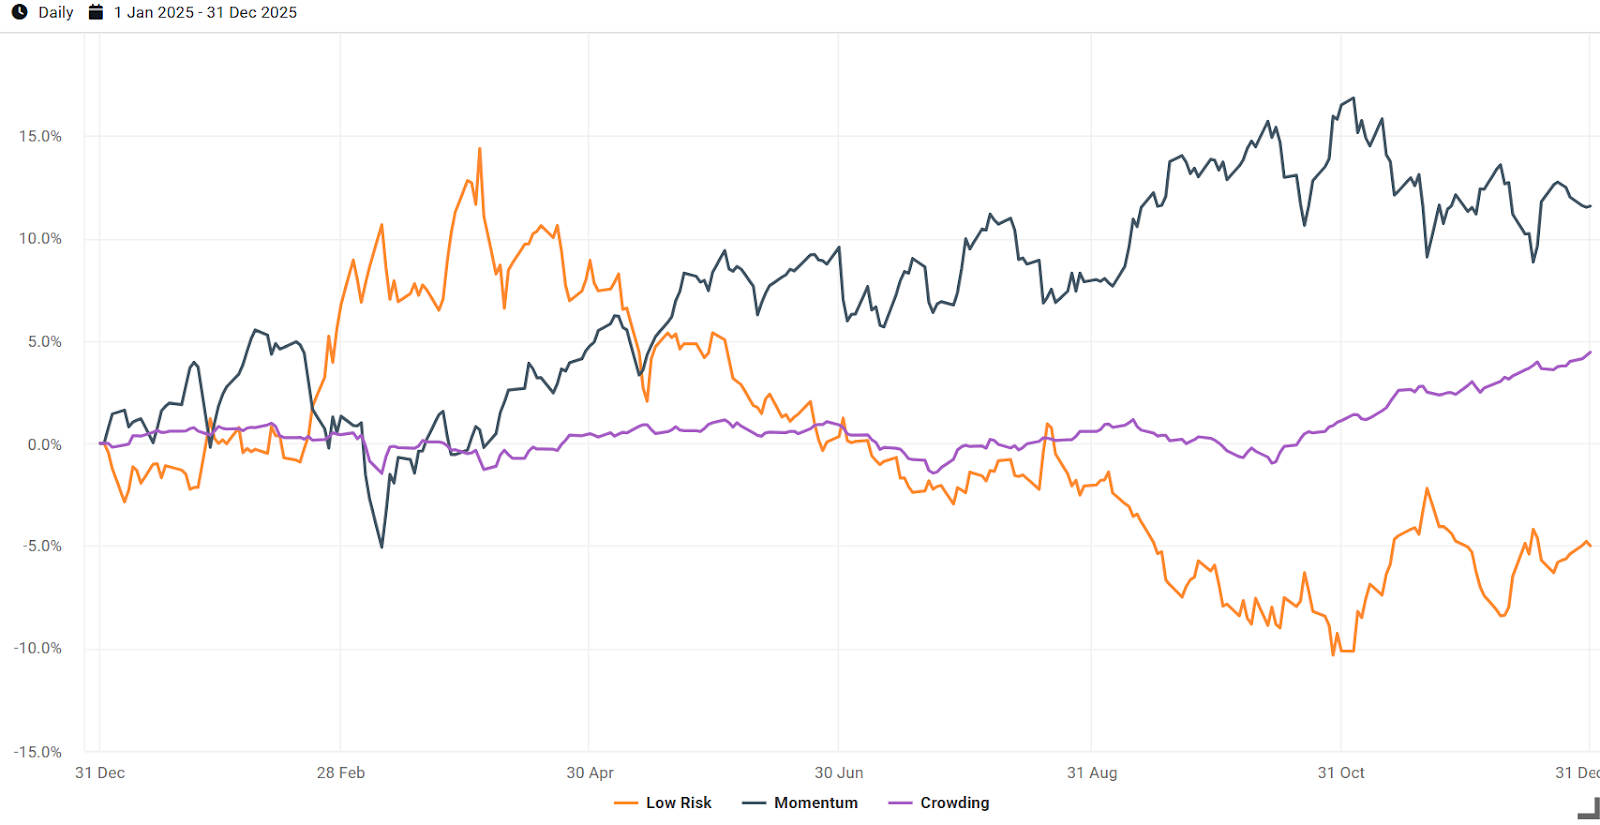
As we can see in Exhibit 7, Low Risk and Momentum showed a strong negative correlation throughout the year (appx. -0.47 with a historical average of just -0.07). Low Risk outperformed before LD and struggled afterwards as worries waned and riskier stocks outperformed. Momentum, similar to Trend Following, struggled to identify and benefit from trends before LD, but rallied as post-LD worries were slowly but surely alleviated and relative performance trends became more robust.
Crowding, which historically has a very low annualized volatility of just 2.34%, didn’t have a significant reaction to markets until mid-October when it began a pronounced rally. Given that this is a common hedge fund exposure, it suggests hedge funds may have caught a tailwind in the final months of 2025, a potential boost for institutions allocating to them.
Goodbye to 2025
To our readers, thank you for tuning into Venn’s factor insights this year. History books will likely remember 2025 as a positive year for equities, but examining the factors institutional portfolios are exposed to shows a more nuanced story. As we’ve discussed, much of it came down to how factors reacted to Liberation Day and then digested a more-normal-than-expected environment afterwards.
In 2026, we plan to move to quarterly factor performance reports, but as always, please reach out to vennsales@twosigma.com with any questions, scientific discoveries, or other things we should be thinking about.
Happy New Year!
Appendix
Exhibit 8: Two Sigma Factor Lens Performance in December

References
1 https://www.cnn.com/2025/03/04/economy/global-markets-trump-tariffs
2 https://www.msci.com/documents/10199/8d97d244-4685-4200-a24c-3e2942e3adeb
Exposure to risk factors is not a guarantee of increased performance or decreased risk. References to the Two Sigma Factor Lens and other Venn methodologies are qualified in their entirety by the applicable documentation on Venn.
This article is not an endorsement by Two Sigma Investor Solutions, LP or any of its affiliates (collectively, “Two Sigma”) of the topics discussed. The views expressed above reflect those of the authors and are not necessarily the views of Two Sigma. This article (i) is only for informational and educational purposes, (ii) is not intended to provide, and should not be relied upon, for investment, accounting, legal or tax advice, and (iii) is not a recommendation as to any portfolio, allocation, strategy or investment. This article is not an offer to sell or the solicitation of an offer to buy any securities or other instruments. This article is current as of the date of issuance (or any earlier date as referenced herein) and is subject to change without notice. The analytics or other services available on Venn change frequently and the content of this article should be expected to become outdated and less accurate over time. Two Sigma has no obligation to update the article nor does Two Sigma make any express or implied warranties or representations as to its completeness or accuracy. This material uses some trademarks owned by entities other than Two Sigma purely for identification and comment as fair nominative use. That use does not imply any association with or endorsement of the other company by Two Sigma, or vice versa. See the end of the document for other important disclaimers and disclosures. Click here for other important disclaimers and disclosures.