
The “Magnificent 7” – Alphabet, Apple, Amazon, Meta, Microsoft, Nvidia, and Tesla – have earned their moniker due to their size, influence, and cultural relevance. But, let’s be honest. None of that would matter to investors if these companies hadn’t also delivered magnificent returns.
But how much of that performance has been unique, and what might their past returns tell us about their future potential?
In this piece, we will aim to answer these questions in three parts:
- Part 1: Performance and Risk Over the Last Decade
- Part 2: Factor-Based Performance and Risk Over the Last Decade
- Part 3: Factor-Based Forecasted Performance and Risk Over the Next Decade
Part 1: Performance and Risk Over the Last Decade
Let’s set the stage by comparing straightforward performance and risk metrics for the Magnificent 7 and the S&P 500 over the last decade. To add further context, we also included a “MAG 7 portfolio”, which was equally weighted across these seven stocks and rebalanced quarterly.
Exhibit 1: Risk and Return of the Magnificent 7
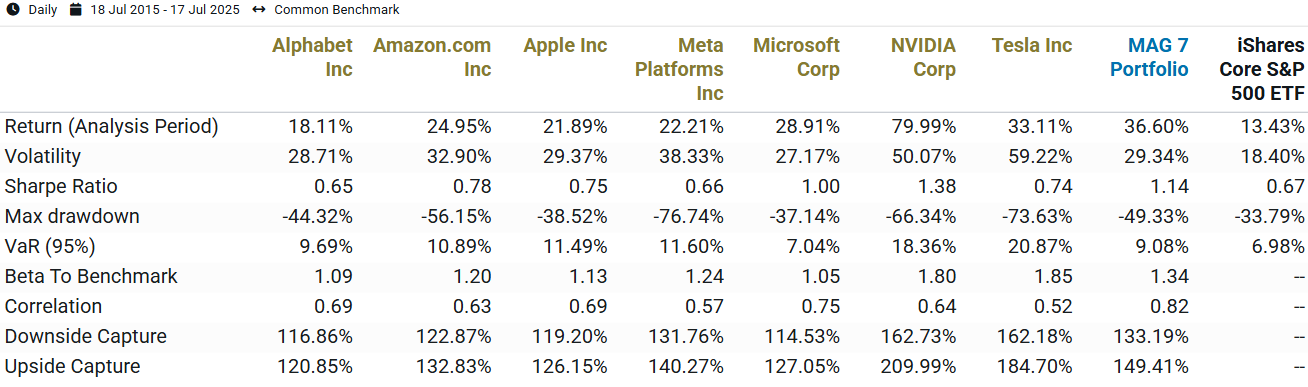
Source: Venn by Two Sigma.
It likely comes as no surprise that the Magnificent 7 stocks have delivered both higher returns and higher volatility than the S&P 500. With the exception of Meta and Alphabet, their Sharpe ratios are also higher, indicating that they provided more compensation per unit of risk.
However, this analysis leaves out key insights.
Each of these stocks was undoubtedly exposed to the broader equity market, but how much of their return can be attributed to that exposure versus something truly unique?
Put another way, is there anything “magnificent” about having a higher beta to equities?
To answer these questions, we need to go deeper using the Two Sigma Factor Lens.
Part 2: Factor-Based Performance and Risk Over the Last Decade
Let’s start by breaking down each security’s exposure (beta) to fundamental market risks through our factor lens analysis over the last decade.
Exhibit 2: Two Sigma Factor Lens Exposures of the Magnificent 7
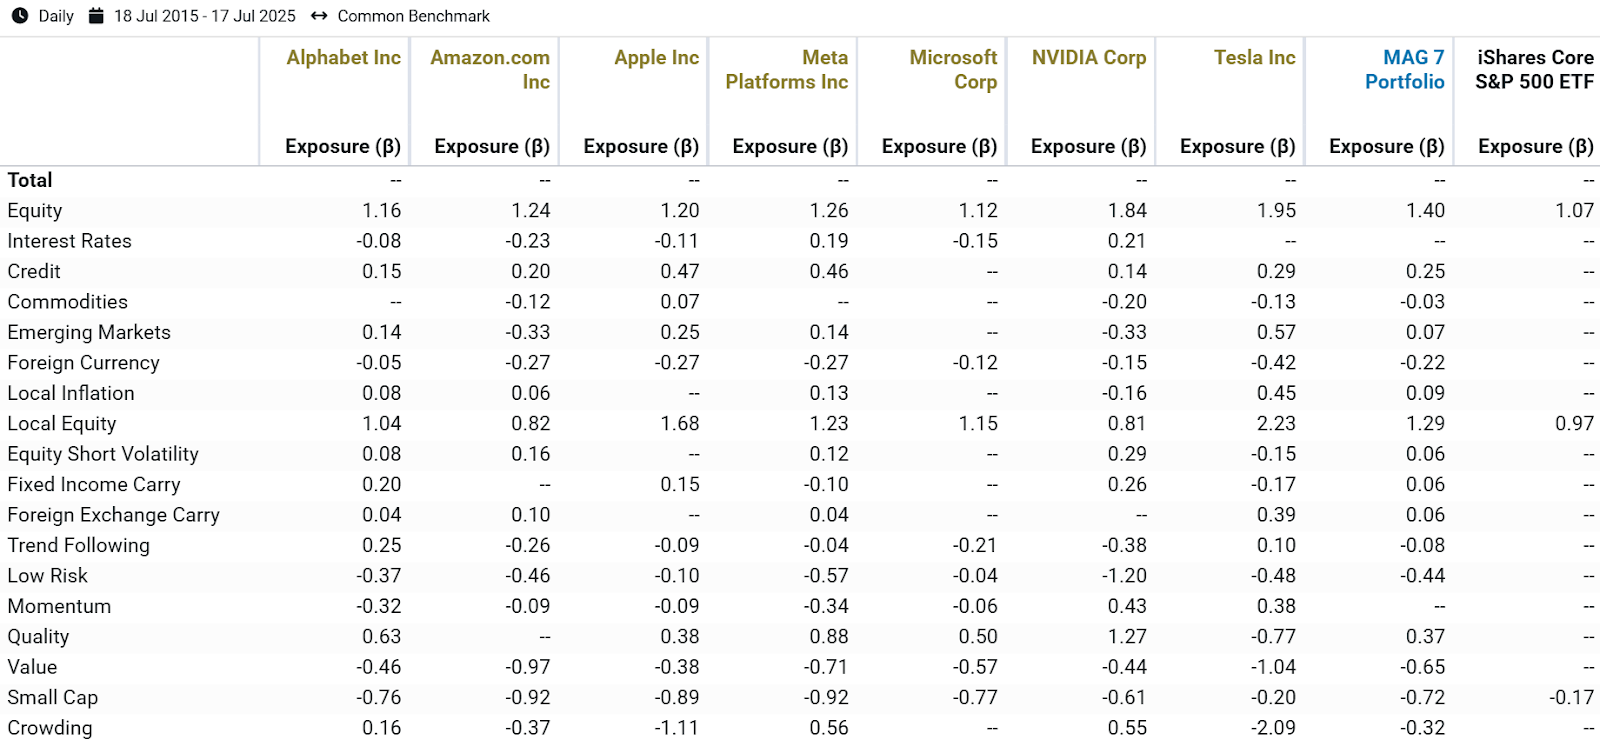
Source: Venn by Two Sigma. Not all factors are statistically significant.
- Equity: Tesla and Nvidia exhibited the highest sensitivity to our global Equity factor, with betas of 1.95 and 1.84, respectively. All of the Magnificent 7 had Equity factor betas meaningfully above 1.00.
- Local Equity: Tesla and Apple were the most sensitive to a pure U.S. market factor, as shown by their higher exposure to our Local Equity factor. Amazon and Nvidia have had less exposure to our Local Equity factor than the S&P 500.
- Quality: Tesla showed a negative beta to our Quality factor, while our factor selection methodology excluded it for Amazon. However, the MAG 7 portfolio still had a positive Quality beta since the remaining stocks displayed notable positive exposure to this factor.
- Low Risk: All seven stocks had negative betas to our Low Risk factor, with Nvidia standing out as the most sensitive. In contrast, Microsoft had a Low Risk beta close to zero.
- Value: Every stock exhibited negative Value exposure over this period. If you consider negative Value as a proxy for growth, then Tesla, and Amazon were the most growth oriented.
The Factor-Based Return Profile of the Magnificent 7 and an Introduction to Residual
Where things really get interesting is looking at factor contribution to return, but first, some context on the term “residual”.
Residual represents the portion of return driven by risks that are uncorrelated with the Two Sigma Factor Lens. For individual stocks, it is expected that residual will be a primary driver of both risk and return, powered by unique characteristics that cannot be replicated in a systematic way.
However, it is true that residual can include systematic risk factors not captured in our lens. For example, in this case, a technology sector factor comes to mind. One way to detect systematic risks hidden in residual is by looking at residual correlations with each other. The lower the correlation is between Magnificent 7 residuals, the more likely it is that each residual represents unique idiosyncratic stock risk.
Given that the average absolute correlation was just 0.09, there is strong evidence that residual between these stocks is truly unique.
Exhibit 3: Residual Correlations of the Magnificent 7
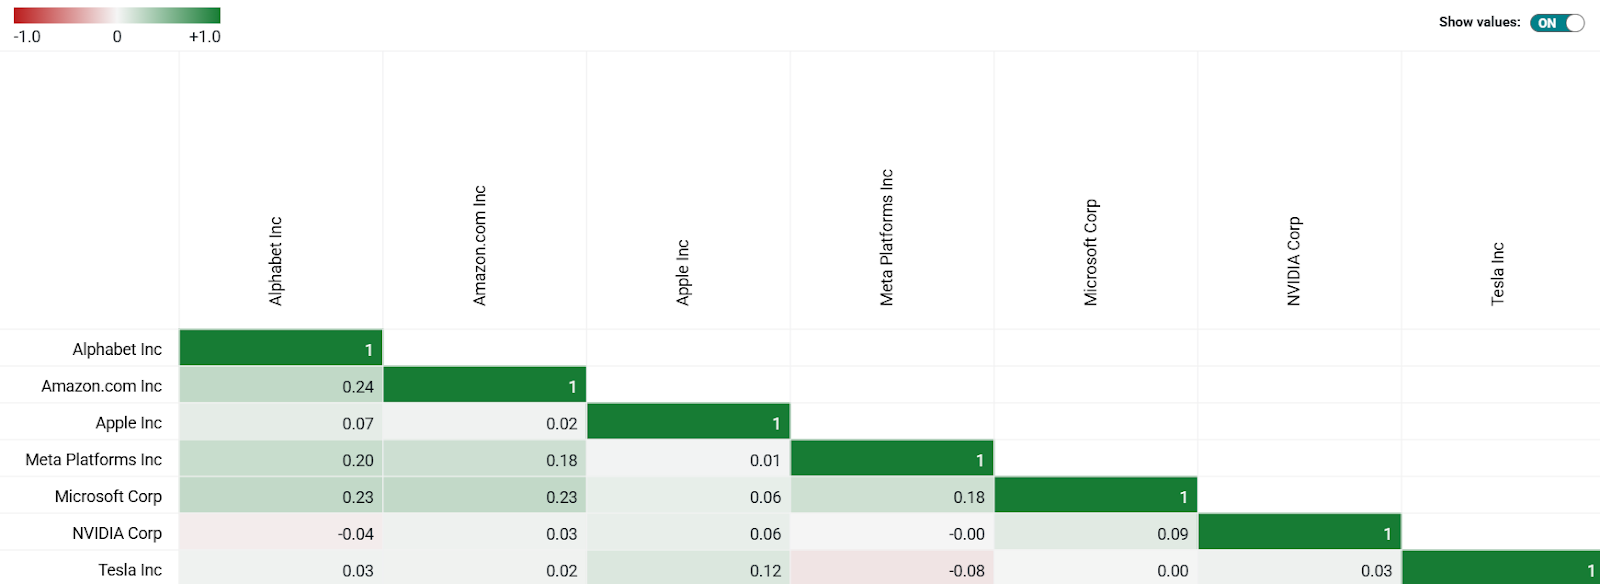 Source: Venn by Two Sigma. Period from 7/18/2015–7/17/2025.
For a stock to be truly “magnificent,” one would expect its return to be more than just positive return due to our Equity factor. If we assume each stock’s residual represents their unique idiosyncratic risk, magnificence would require that its residual was meaningfully positive.
Let’s find out if that was true by looking at Factor Contribution to Return.
Exhibit 4: Two Sigma Factor Lens Contribution to Return of the Magnificent 7
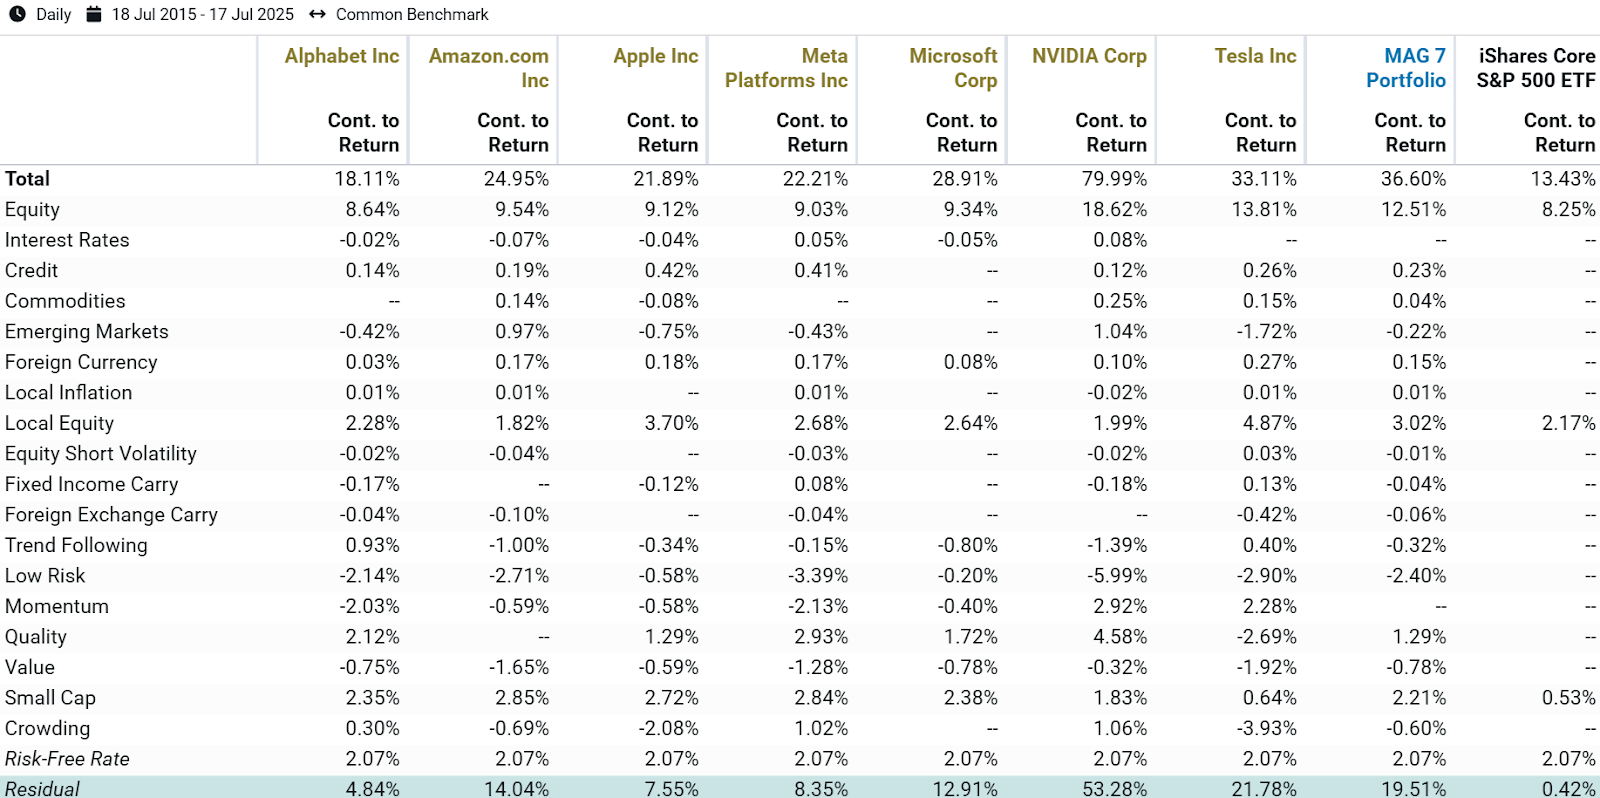 Source: Venn by Two Sigma. Not all factors are statistically significant.
Exhibit 4 suggests that these stocks have truly been magnificent over the last decade:
- All Magnificent 7 stocks achieved meaningfully high residual return, with some outperforming the total return of the S&P 500 by this measurement alone.
- Nvidia achieved 53.28% per year residual return.
- Despite having the lowest residual return among the Magnificent 7, Alphabet still posted 4.84% per year.
- Not shown here are residual Sharpe ratios. Nvidia and the MAG 7 portfolio achieved the highest residual Sharpe ratios at 1.61 and 1.55 respectively. The lowest residual Sharpe ratios were Meta and Alphabet at 0.26 and 0.23 respectively.
The takeaway: The Two Sigma Factor Lens shows that while the Magnificent 7 do have positive return contributions from various systematic factors, including the equity risk premium, their residual components appear to have been truly “magnificent” drivers of return.
Considering Factor Contribution to Return on a Percentage Basis
Another way to compare this “magnificence” is to view it in a more normalized way. For example, Exhibit 5 considers what percentage of total return came from our Equity factor versus residual for each stock.
Exhibit 5: Percent Contribution to Return of our Equity Factor and Residual to Total Return
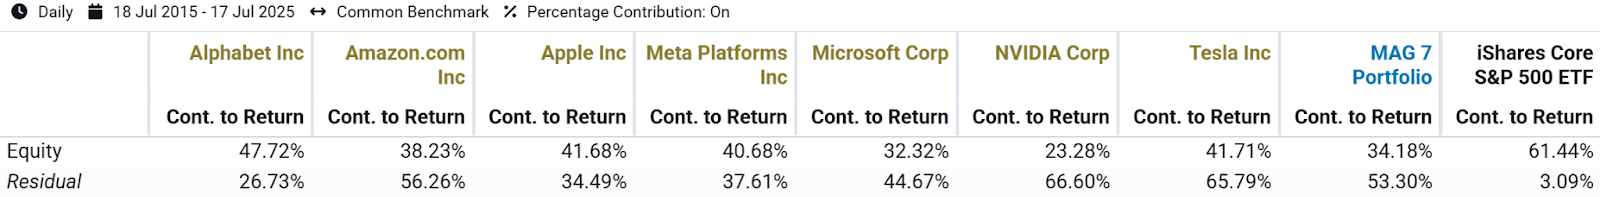
Exhibit 5 shows that:
- Apple, Alphabet and Meta had a higher share of total return driven by our Equity factor than residual. These stocks’ total return was the most dependent on broad equity movements among the Magnificent 7.
- In contrast, Amazon, Microsoft, Nvidia, and Tesla had the majority of their return driven by residual. These stocks’ total return was the least dependent on broad equity movements among the Magnificent 7.
Part 3: Factor-Based Forecasted Performance and Risk Over the Next Decade
The analysis above raises an important question: can we expect this magnificence to continue? We've seen that much of these stocks’ outperformance came from residual returns, which is the hardest component to predict or replicate systematically. Meanwhile, their factor exposures, which may be more persistent, suggest a different story.
For example, when we consider that these stocks have had a beta above 1 to our Equity factor over the past decade (Exhibit 2), there is a natural forward-looking intuition that can come into play.
1. Many investors might assume that these stocks will continue to maintain positive Equity factor exposure.
2. Given that the equity risk premium has been positive historically and has solid economic rationale as to why, it is reasonable to expect that this will continue to benefit the Magnificent 7 over longer periods.
But how can we quantify forward-looking expectations in a more holistic way that includes residual? For this, we will apply Venn’s factor-based forecasting.
Applying Factor-Based Forecasting to the Magnificent 7
As a disclaimer, if you’re hoping our next section will predict future performance, sorry to disappoint, but it won’t. It is purely hypothetical. That said, factor-based forecasting remains one of many powerful tools that can be used for investment analysis, especially for managers of diversified funds, multi-asset portfolios, or other broad investment baskets. In the case of individual stocks, it’s true that they are less likely to be fully explained by systematic risks and can change their risk profiles quickly, but factor-based forecasts can still provide valuable context.
With that said, Exhibit 6 shows the 10-year factor-based forecasted risk and return for the Magnificent 7. Important are the related assumptions that are customizable in Venn. For our analysis, we assume:
- Each stock’s factor exposures over the last 10 years will remain unchanged for the next 10 years.
- Each stock’s residual returns over the previous 10 years will be the same over the next 10 years.
- Factor and cash returns take a longer-term perspective, using their full available history to interpret the impact of factor exposures.1
Exhibit 6: Factor-Based Forecasts
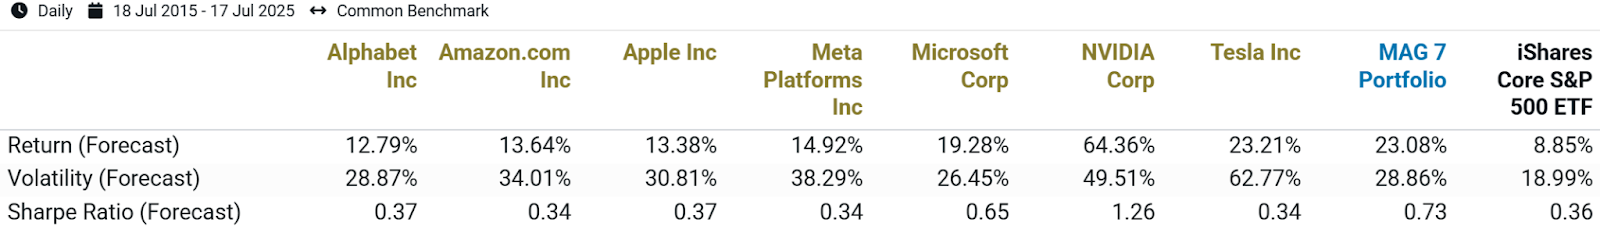 Source: Venn by Two Sigma.
In this hypothetical 10-year forecast, Venn suggests the following based on the above-stated assumptions:
- Each member of the Magnificent 7 is expected to outperform the S&P 500 over the next decade.
- Alphabet, Amazon, Meta, Apple, and Tesla would each be expected to achieve a Sharpe ratio very similar to that of the S&P 500.
- Lower forecasted returns than realized returns (from Exhibit 4) suggest that these stocks’ factor exposures were especially strong over the last decade compared to what would be suggested by longer-term average factor returns. For example, the Equity factor captured 7.81% over the last decade, but a smaller 5.15% over the full history of the Two Sigma Factor Lens.
Perhaps most interesting is to consider this 10-year forecast in a world where the residual return for all of these stocks is set to zero. In other words, a scenario where these stocks are not “magnificent.”
Exhibit 7 does exactly this, representing the hypothetical forward-looking pure factor return of each stock. Many would view this portion of return as being considerably more predictable than residual, even if it might be less influential.2
Exhibit 7: Factor-Based Forecasts with Residual Return Set to Equal 0%
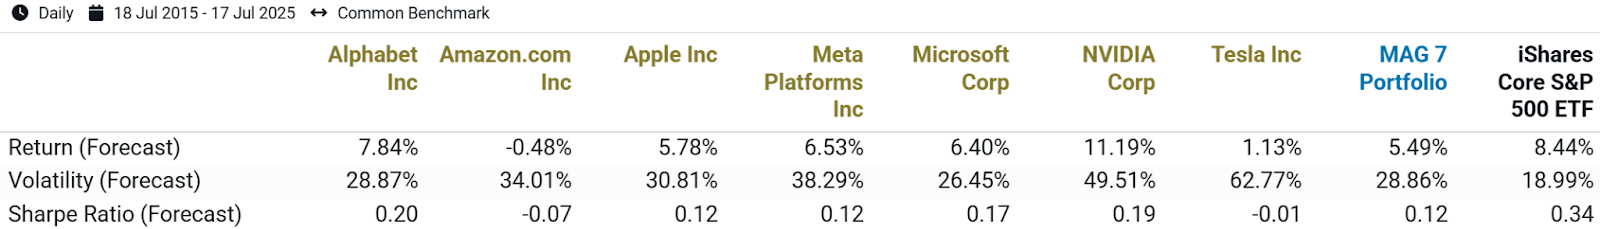
With 0% residual return,3 we have a cleaner way to view the fundamental context for each security:
- Nvidia has the highest factor-based forecasted return at 11.19%, with Alphabet coming in second at 7.84%.
- Nvidia is the only stock whose factor-based forecasted return is expected to outperform the S&P 500, without the benefit of positive residual return.
- Amazon has a negative factor-based forecasted return. In a hypothetical world where our assumptions came true, one would need to believe that its residual return would more than offset the negative return implied by its factor exposures.
Quantifying the Magnificence of the Magnificent 7
As most readers of this blog likely know, past performance is not indicative of future results.
With that said, it’s fair to say that the ‘Magnificent 7’ industry moniker is supported by our measurements. The included stocks achieved strong positive returns driven by risk that is uncorrelated with the Two Sigma Factor Lens. Most importantly, we believe that this portion of return would be nearly impossible to replicate in a systematic way.
Under the assumption that residual return will be 0% over the next decade in our hypothetical model, all stocks except Amazon are forecasted to have a positive return, but with only Nvidia hypothetically forecasted to outperform the S&P 500.
Only time will tell if the Magnificent 7 can continue to be magnificent, but Venn can help quantify it. The Two Sigma Factor Lens is designed for users to be able to isolate residual for all assets with a return stream, including hedge funds and multi-asset portfolios.
References
1The Two Sigma Factor Lens returns date back to as of 8/7/1998.
2Note that the S&P 500 has very little residual return. In other words, its performance can be almost entirely explained by the factors in the Two Sigma Factor Lens. As a result, the S&P 500’s projected outcome is very similar whether we set the forward-looking residual to zero or not.
3While residual return was set to 0% in Exhibit 7, it is still assumed to be present and have the same volatility. This is why volatility does not change from Exhibit 6 to 7, and why Sharpe Ratios are considerably lower in these hypothetical forecasts.
Exposure to risk factors is not a guarantee of increased performance or decreased risk. References to the Two Sigma Factor Lens and other Venn methodologies are qualified in their entirety by the applicable documentation on Venn.
This article is not an endorsement by Two Sigma Investor Solutions, LP or any of its affiliates (collectively, “Two Sigma”) of the topics discussed. The views expressed above reflect those of the authors and are not necessarily the views of Two Sigma. This article (i) is only for informational and educational purposes, (ii) is not intended to provide, and should not be relied upon, for investment, accounting, legal or tax advice, and (iii) is not a recommendation as to any portfolio, allocation, strategy or investment. This article is not an offer to sell or the solicitation of an offer to buy any securities or other instruments. This article is current as of the date of issuance (or any earlier date as referenced herein) and is subject to change without notice. The analytics or other services available on Venn change frequently and the content of this article should be expected to become outdated and less accurate over time. Two Sigma has no obligation to update the article nor does Two Sigma make any express or implied warranties or representations as to its completeness or accuracy. This material uses some trademarks owned by entities other than Two Sigma purely for identification and comment as fair nominative use. That use does not imply any association with or endorsement of the other company by Two Sigma, or vice versa. See the end of the document for other important disclaimers and disclosures. Click here for other important disclaimers and disclosures.