
An important differentiator for the Venn platform is the ability to use only returns to conduct sophisticated portfolio analytics. Advantages to this approach include being able to analyze anything with a return stream, whether it be a unique asset class such as wine, or a private asset manager. Returns-based analysis also has the ability to decompose performance across common risk factors in the market. This can provide transparency into “how” and “why” an investment performed the way it did, despite no transparency into the holdings.
However, even though returns-based analysis is effective without any holdings data, such data can provide additional context for a portfolio or investment manager. As a result, Venn has launched the ability to aggregate holdings data such as asset class, geography, and sector among mutual funds, ETFs, and individual stocks. Currently, holdings data is available in Venn’s Report Lab and Studio modal.1 We believe this will provide investors even more context for their returns-based analysis and, importantly, their investment reporting.
Let’s walk through a case study using Venn’s returns-based analysis and holdings data together, showcasing how putting these features side-by-side can help with understanding risk and crafting investment narratives.
Starting with Returns-Based Factor Analysis
Without conducting any analysis on The Growth Fund of America (AGTHX), one might think from the name that this is a U.S. equity growth fund.2 As a result, one might expect large exposure to factors such as Equity and Local Equity, and negative exposure to Value.
Venn analysis in Exhibit 1 demonstrates that these three factors are among the most meaningful exposures for this manager over time. (Not shown here is Venn identifying that 83.20% of this manager's risk is driven by our Equity Factor, further suggesting an equity-focused approach.)
Exhibit 1: AGTHX Factor Exposure

Source: Venn by Two Sigma. The chart displays factor analysis for AGTHX viewed through the Two Sigma Factor Lens from 10/3/1997-11/23/2023
Continuing with only returns-based analysis, let's take a look at factor contribution to active exposure versus the Russell 1000 Growth (R1G), which we know is a U.S. equity-focused growth benchmark.
Interestingly, Local Equity exposure is now meaningfully negative when looking at active exposure in Exhibit 2. This implies that AGTHX has international exposure, or more specifically, that AGTHX is expected to benefit relative to the R1G when international equities outperform U.S. equities.3
Exhibit 2: AGTHX Relative Factor Exposure to R1G

Source: Venn by Two Sigma. The chart displays factor analysis for AGTHX viewed through the Two Sigma Factor Lens from 10/3/1997-11/23/2023. Relative to benchmark analysis is relative to the Russell 1000 Growth Index.
This negative relative Local Equity exposure may be a surprise since earlier we assumed both were 100% U.S.-oriented. Perhaps these are spurious results? In Exhibit 3, we found that this exposure versus the R1G has been persistent over time, suggesting this may be an intended active bet.
Exhibit 3: AGTHX Relative Factor Exposure Trend of Local Equity Versus R1G

Source: Venn by Two Sigma. The chart displays factor analysis for AGTHX viewed through the Two Sigma Factor Lens from 10/3/1997-11/23/2023. Relative to benchmark analysis is relative to the Russell 1000 Growth Index.
In Exhibit 4, we see that recently this difference has been explaining meaningful active risk. In fact, over the most recent 3-year rolling period, the difference in Local Equity exposure explained 17.89% of active risk. This is seeming more curious than spurious.
Exhibit 4: AGTHX Relative Factor Risk Trend of Local Equity Versus R1G
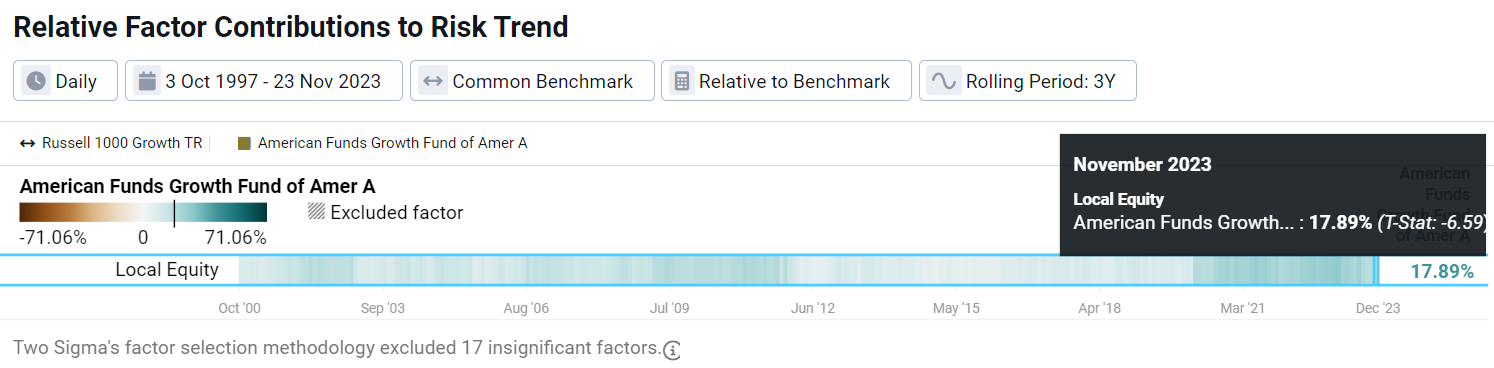
Source: Venn by Two Sigma. The chart displays factor analysis for AGTHX viewed through the Two Sigma Factor Lens from 10/3/1997-11/23/2023
Connecting the Dots with Holdings Data
By using Venn’s new holdings data, we found that indeed this manager is holding 93.16% in equities, with much of the rest in cash (Exhibit 5). Additionally, we see that technology has the largest sector exposure at 23.40%, in line with their growth-focused approach (Exhibit 6).
Exhibit 5: AGTHX Asset Class Classification
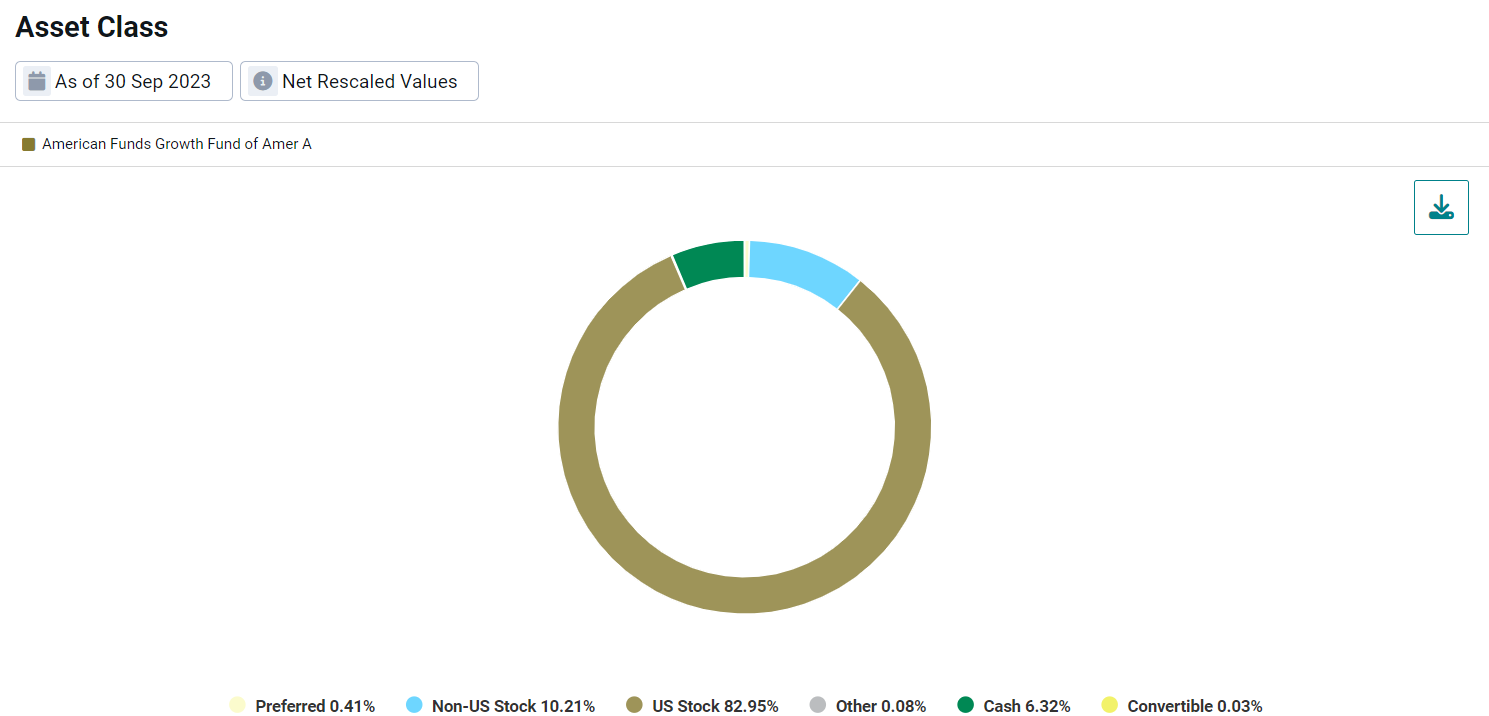
Source: Venn by Two Sigma as of 11/23/2023
Exhibit 6: AGTHX Sector Classification

Source: Venn by Two Sigma as of 11/23/2023.
Importantly, we found that the Growth Fund of America has 10.21% allocated to non-U.S. stock. Specifically, it has 5.81% (Exhibit 7) exposure to greater Europe, including 1.86% in the Netherlands. Uncovering this manager’s willingness to invest internationally provides color as to why AGTHX may have negative Local Equity exposure compared to the R1G.
Exhibit 7: AGTHX Geography Classification
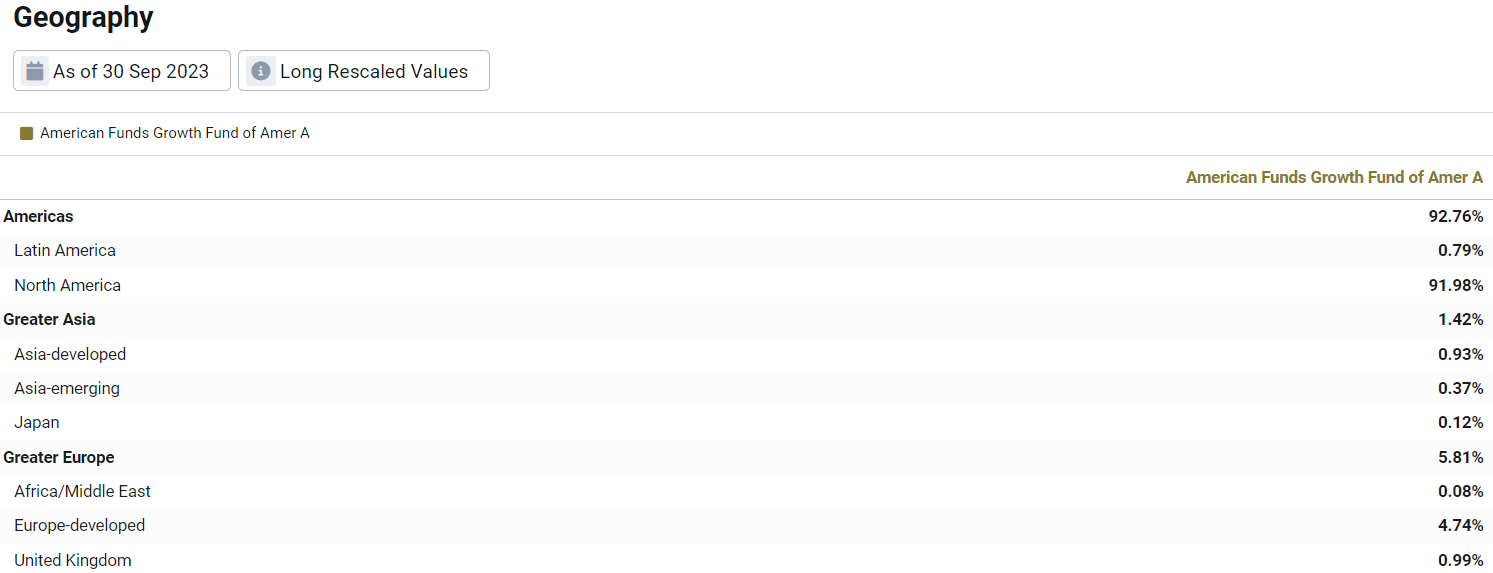
Source: Venn by Two Sigma as of 11/23/2023
In this example, combining returns-based insights with holdings-level context created a more robust narrative to interpret this manager’s performance. This same exercise can be applied with different factors and in a variety of ways, including multi-asset portfolios.
It is worth noting that returns-based analysis includes the ability to identify that this manager’s negative exposure to Local Equity has been an annualized -0.35% drag on excess return vs the R1G. This suggests that international equity bets relative to the R1G have not paid off.
Exhibit 8: Contribution to Return of Relative Local Equity Exposure, AGTHX vs R1G

Source: Venn by Two Sigma. The table displays factor analysis for AGTHX viewed through the Two Sigma Factor Lens from 10/3/1997-11/23/2023
Empowering Returns-Based Analysis with Holdings Context
Our goal in launching this functionality is to enhance our existing returns-based approach with the ability to see basic holdings data. This adds a new dimension to the Venn platform, which we believe furthers our ability to act as a holistic tool for manager evaluation and multi-asset portfolio analysis.
In this piece, we highlighted how results from returns-based factor analysis can prompt a deeper dive into holdings, and how those holdings may support or increase confidence in returns-based analysis. Stay tuned for more examples of utilizing returns-based analysis side by side with holdings data.
References
1 Venn’s Studio is currently in Beta. Please note that extra fees may apply for Report Lab.
2 For this case study, The Growth Fund of America (AGTHX) was selected randomly from a list of U.S.-focused funds with an eye towards those with international exposure.
3 Other factors may also suggest international exposure relative to the Russell 1000 Growth, such as AGTHX’s relative positive exposure to Foreign Currency.
This article is not an endorsement by Two Sigma Investor Solutions, LP or any of its affiliates (collectively, “Two Sigma”) of the topics discussed. The views expressed above reflect those of the authors and are not necessarily the views of Two Sigma. This article (i) is only for informational and educational purposes, (ii) is not intended to provide, and should not be relied upon, for investment, accounting, legal or tax advice, and (iii) is not a recommendation as to any portfolio, allocation, strategy or investment. This article is not an offer to sell or the solicitation of an offer to buy any securities or other instruments. This article is current as of the date of issuance (or any earlier date as referenced herein) and is subject to change without notice. The analytics or other services available on Venn change frequently and the content of this article should be expected to become outdated and less accurate over time. Any statements regarding planned or future development efforts for our existing or new products or services are not intended to be a promise or guarantee of future availability of products, services, or features. Such statements merely reflect our current plans. They are not intended to indicate when or how particular features will be offered or at what price. These planned or future development efforts may change without notice. Two Sigma has no obligation to update the article nor does Two Sigma make any express or implied warranties or representations as to its completeness or accuracy. This material uses some trademarks owned by entities other than Two Sigma purely for identification and comment as fair nominative use. That use does not imply any association with or endorsement of the other company by Two Sigma, or vice versa. See the end of the document for other important disclaimers and disclosures. Click here for other important disclaimers and disclosures.
This article may include discussion of investing in virtual currencies. You should be aware that virtual currencies can have unique characteristics from other securities, securities transactions and financial transactions. Virtual currencies prices may be volatile, they may be difficult to price and their liquidity may be dispersed. Virtual currencies may be subject to certain cybersecurity and technology risks. Various intermediaries in the virtual currency markets may be unregulated, and the general regulatory landscape for virtual currencies is uncertain. The identity of virtual currency market participants may be opaque, which may increase the risk of market manipulation and fraud. Fees involved in trading virtual currencies may vary.