
Exhibit 1: Which Factors Have Had Strong Or Poor Starts to 2025
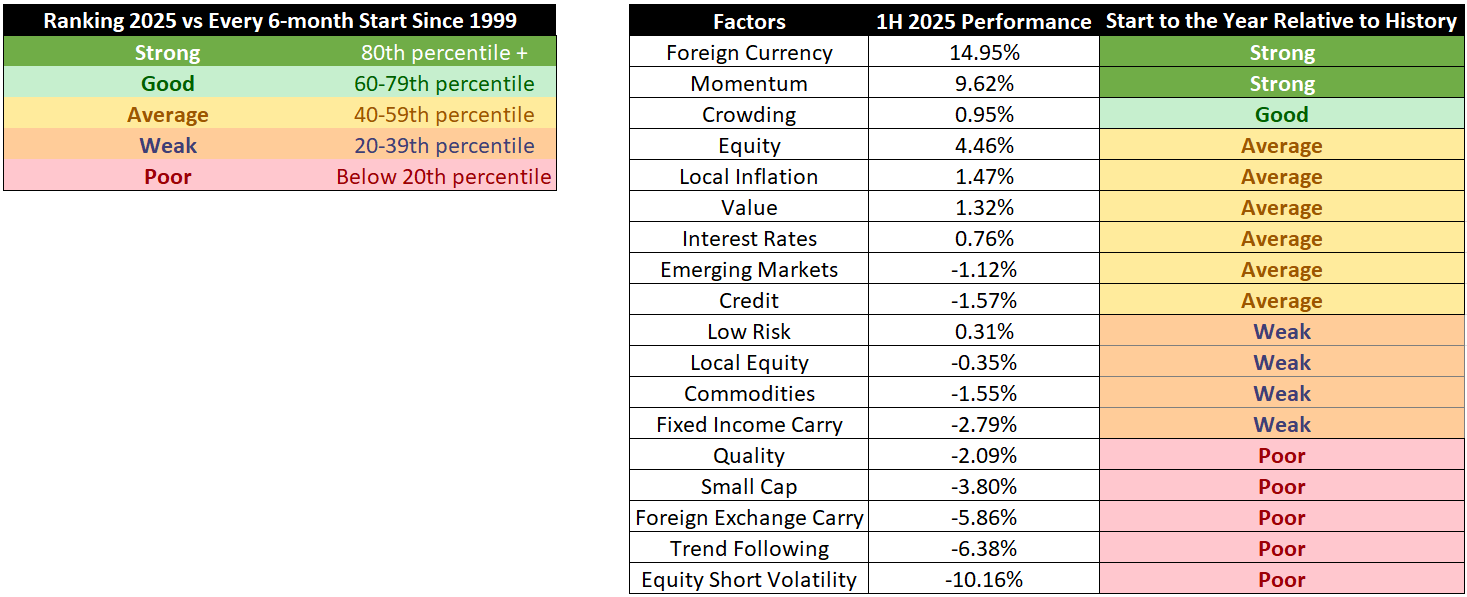
Source: Venn by Two Sigma. Percentile ranks 1H 2025 performance of each factor with every other calendar year’s 1H performance. With the exception of Crowding, analysis covers calendar years from 1999–2024. Crowding is from 2007–2024.
Strong Starts: Institutional investors with meaningful positive exposure to Venn’s Foreign Currency or Momentum factors benefited greatly given their historically strong starts to the year.
Venn's Foreign Currency factor delivered its strongest 1H ever, driven by USD weakness, as investors navigated capital flight from the United States and continued expectations of Fed rate cuts. Among individual G10 currency pairs, the Swedish Krona appreciated the most against the USD, up roughly 17.05% in 1H 2025.2
For USD-based investors, one implication of this is that unhedged international assets have experienced a significant tailwind due to their implicit foreign currency exposure. For example, international equities were up 18.66% in 2025, whereas hedged international equities were up just 9.83% (Exhibit 2).
Note: While the difference between unhedged and hedged exposure is typically driven by our Foreign Currency factor, the Two Sigma Factor Lens finds that other factors may also be at play.
Exhibit 2: YTD Cumulative Return of Unhedged and Hedged Int’l Equities
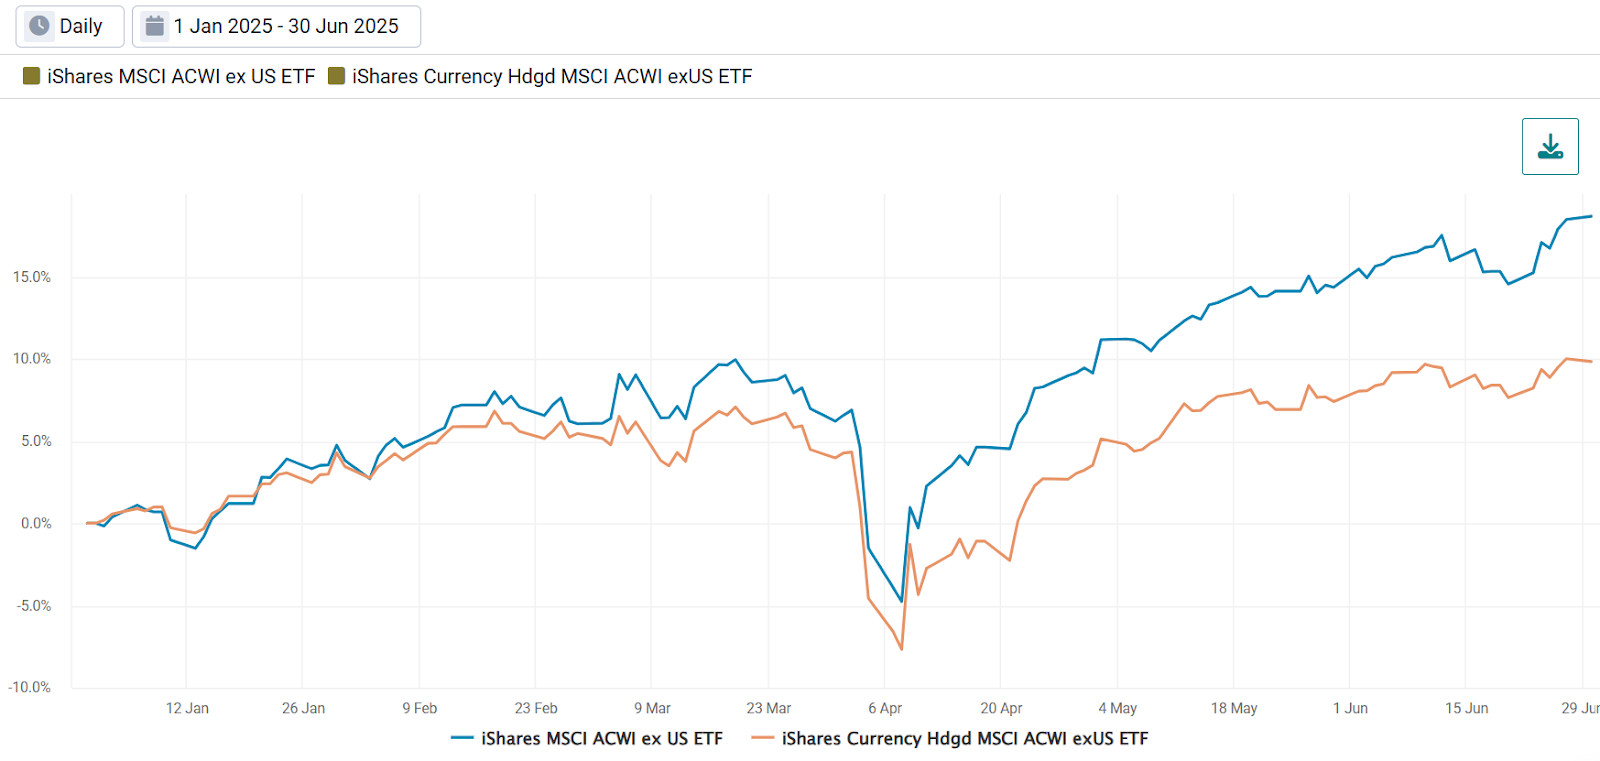
Source: Venn by Two Sigma
Venn's Momentum factor has also had a historically strong start in 2025, gaining 9.62%. Most notably, the factor continued its positive trajectory during the April tariff policy shock, posting gains even as broad equity markets declined (Exhibit 3).
Exhibit 3: YTD Cumulative Return of Venn’s Momentum and Equity Factors
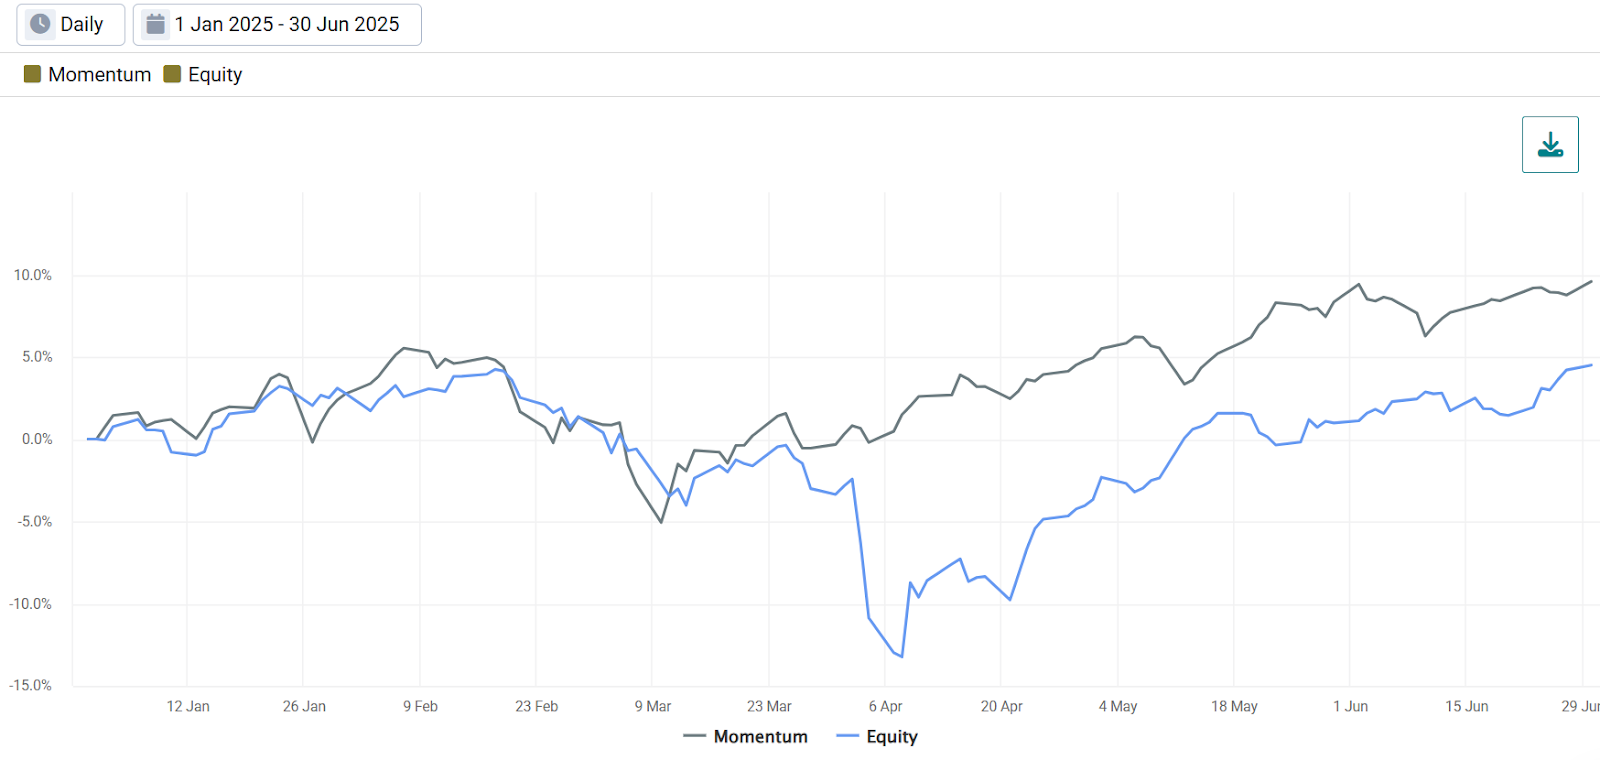 Source: Venn by Two Sigma
While Venn's equity style factors are constructed to be independent of broader equity markets through long/short and beta-neutral portfolios, Momentum's strong performance reflects more than just market neutrality. The April tariff policy shock appeared to accelerate existing trends in relative stock performance (AKA the Momentum factor).
This illustrates an important distinction: while tariffs drove broad equity declines, they simultaneously accelerated relative performance trends within equity markets. This shows how macro shocks can have opposing effects at different levels of the investment landscape.
Poor Starts: Five style factors experienced historically poor 1H performance, with Equity Short Volatility posting its worst 1H on record. Style factors are designed to capture systematic risk exposures that institutional investors utilize for enhanced returns, meaning investors with positive exposure to these factors achieved an unwelcome result in 2025.
Exhibit 4: YTD Cumulative Return of Every Venn Factor With a “Poor” Start to the Year
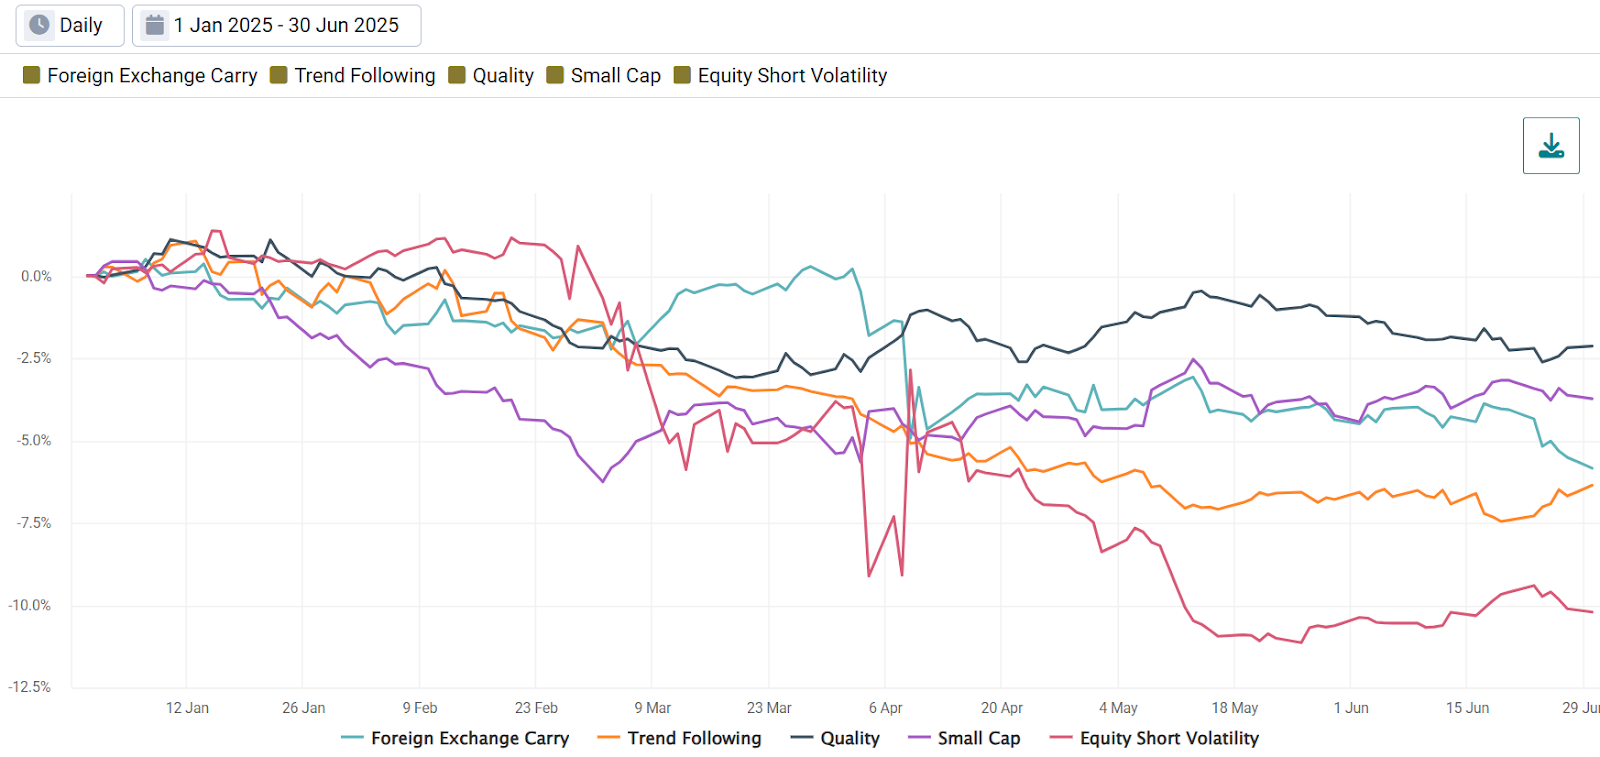 Source: Venn by Two Sigma
Have Factors With Poor Starts Been Able to Recover?
Given the number of poor starts in 2025, a natural question emerges: have factors been able to bounce back from poor 1H performance historically?
To measure this, Exhibit 5 shows how often each factor experienced negative 1H performance but positive calendar year performance in the same year. Notably, in this example we broadened out the definition of a “poor start” to remove historical context and simply mean negative 1H performance.
Exhibit 5: How Likely Has a Factor Been to Recover From a Poor Start?
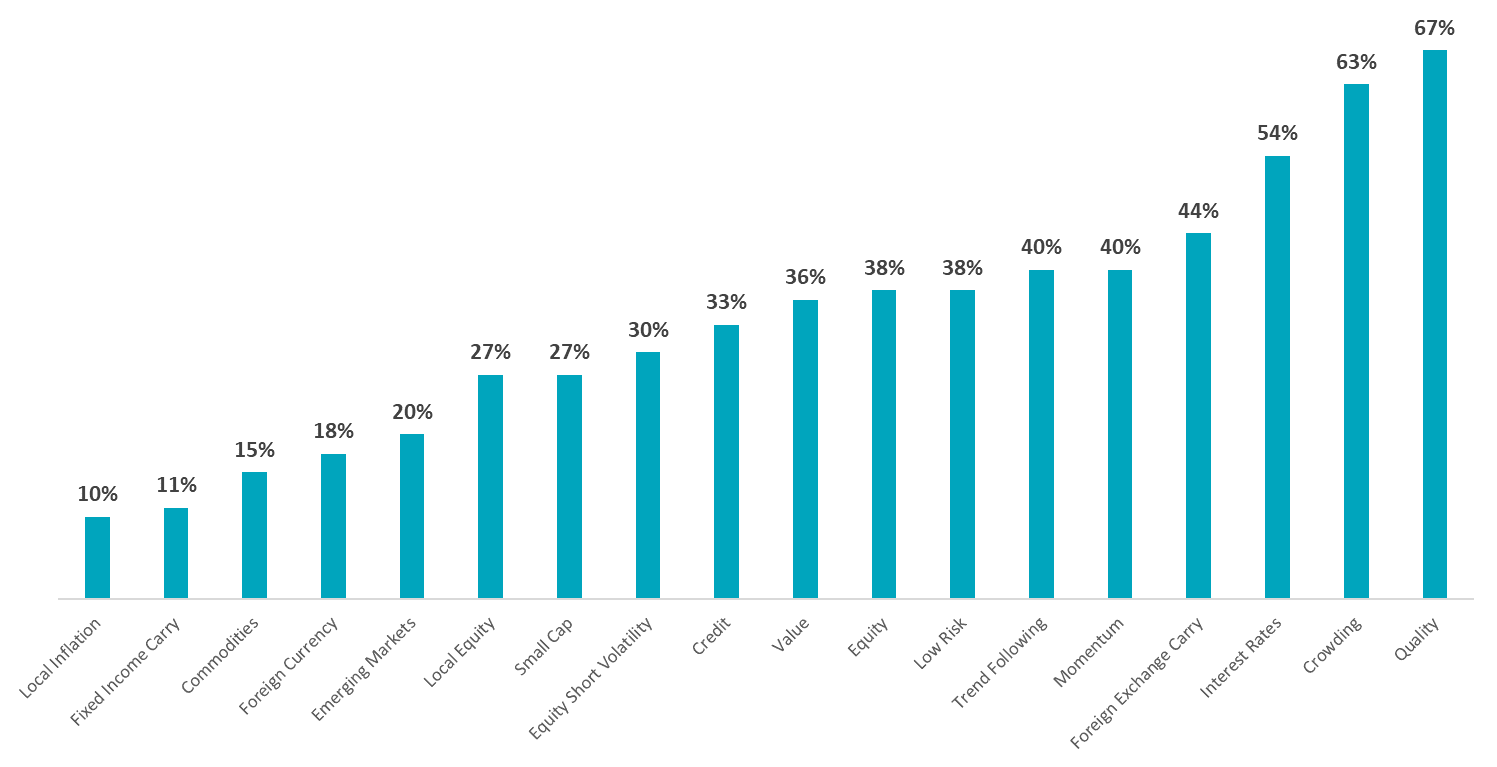 Source: Venn by Two Sigma. With the exception of Crowding, Analysis covers calendar years from 1999–2024. Crowding is from 2007–2024. Corresponding to the chart, from left to right are the number of times a factor experienced a negative return in the first six months of a calendar year: N=10,9,13,17,15,11,11,10,15,11,8,8,5,10,9,13,8,9.
These results reveal both intuitive and surprising patterns:
Intuitive:
- Not all factors are designed to capture return-seeking exposures, some are primarily designed to measure risk. For example, Venn's Local Inflation factor4 is short the inflation risk premium. It is only expected to be positive when inflation hedges pay off due to inflation surprises. This makes it unsurprising to see it as the least likely to finish with positive performance after a negative start. Notably, in 2025 it has been positive as inflation hedges have indeed provided value.
- It seems that the factors least likely to recover after a poor start fell into two categories: those without a strong economic rationale for positive return premiums (Foreign Currency and Local Equity), and those with a rationale that hasn't translated into consistent positive returns under Venn's construction (Commodities, Emerging Markets, and Small Cap).5 While timing plays a role in all of these results, generally speaking, it is reasonable to expect that these factors will have a lower number of positive calendar year returns.
- Conversely, factors with both the expectation and history of positive return premiums were more likely to finish positive after poor 1H performances.6
Surprising:
- The most surprising finding was the lack of consistency in terms of factors with a poor start being able to finish positively. One might expect more random outcomes. If anything, one might expect that a majority would finish the year in positive territory since many of these factors have a positive return over their full history.
- Whether due to timing or something else, the data revealed that 14 out of 18 factors were able to recover from their negative 1H returns only 40% of the time or less. Of course, these are strictly historical outcomes and should be taken as an interesting insight alongside market context.
- Fixed Income Carry's7 low recovery percentage (11%) was particularly unexpected given that this factor has delivered a positive return premium and is widely considered a source of systematic alpha. However, a closer look reveals that its premium has been relatively modest back to 1998 (~1% annually), which may explain why poor 1H performance was less likely to be offset by a year-end recovery, compared to factors with higher return premiums.
Appendix:
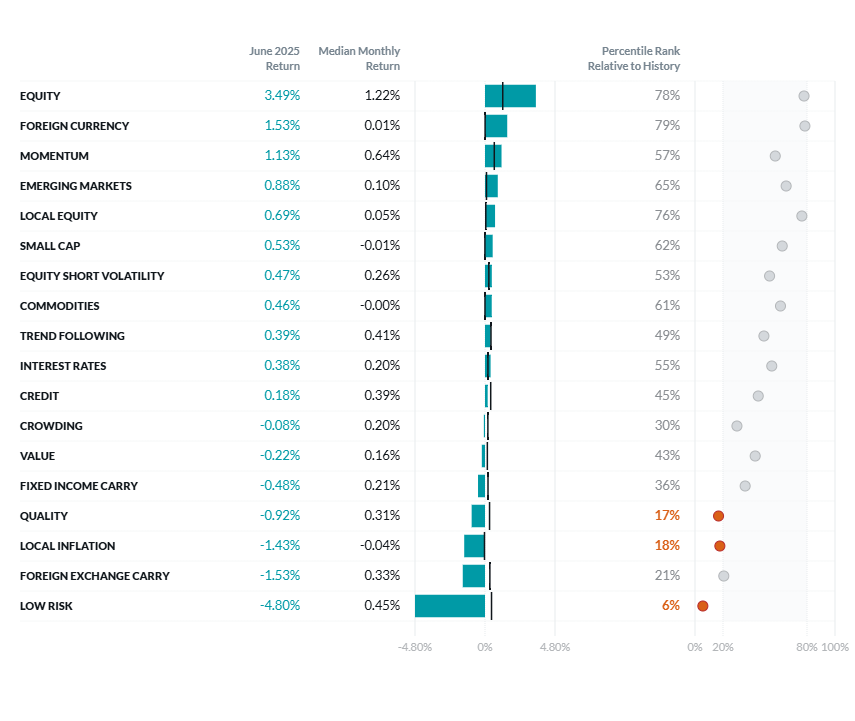
Two Sigma Factor Lens Performance for June
©2025 Two Sigma Investments, LP. This image is for informational purposes only. See https://www.venn.twosigma.com/blog-disclaimer for more disclaimers and disclosures.
Source: Venn by Two Sigma. The median and percentile columns measure the performance of each factor in the Two Sigma Factor Lens relative to the entire history of the factor in USD, using monthly data for the period August 1998 - June 2025.

References
1The Foreign Currency Factor is residualized against Equity, Interest Rates, Credit, and Commodities factors.
2For an explanation of how each factor is residualized: i.e., decorrelated from higher-tier factors, please see our piece on residualization. This provides a helpful background for interpreting factor performance in this commentary.
3Source: Bloomberg.
4The Local Inflation factor is residualized against Equity, Interest Rates, Credit, and Commodities factors.
5The Commodities factor is residualized against Equity and Interest Rates factors. The Emerging Markets factor is residualized against Equity, Interest Rates, Credit, and Commodities factors.
6We would consider Fixed Income Carry, Equity Short Volatility, Credit, Value, Equity, Low Risk, Trend Following, Momentum, Foreign Exchange Carry, Interest Rates, Crowding, and Quality to be in this category. Fixed Income Carry is an exception to this insight which we discuss later.
7The Fixed Income Carry factor is residualized against Interest Rates.
Exposure to risk factors is not a guarantee of increased performance or decreased risk. References to the Two Sigma Factor Lens and other Venn methodologies are qualified in their entirety by the applicable documentation on Venn.
This article is not an endorsement by Two Sigma Investor Solutions, LP or any of its affiliates (collectively, “Two Sigma”) of the topics discussed. The views expressed above reflect those of the authors and are not necessarily the views of Two Sigma. This article (i) is only for informational and educational purposes, (ii) is not intended to provide, and should not be relied upon, for investment, accounting, legal or tax advice, and (iii) is not a recommendation as to any portfolio, allocation, strategy or investment. This article is not an offer to sell or the solicitation of an offer to buy any securities or other instruments. This article is current as of the date of issuance (or any earlier date as referenced herein) and is subject to change without notice. The analytics or other services available on Venn change frequently and the content of this article should be expected to become outdated and less accurate over time. Two Sigma has no obligation to update the article nor does Two Sigma make any express or implied warranties or representations as to its completeness or accuracy. This material uses some trademarks owned by entities other than Two Sigma purely for identification and comment as fair nominative use. That use does not imply any association with or endorsement of the other company by Two Sigma, or vice versa. See the end of the document for other important disclaimers and disclosures. Click here for other important disclaimers and disclosures.