
Exhibit 1: Performance and Risk Summary
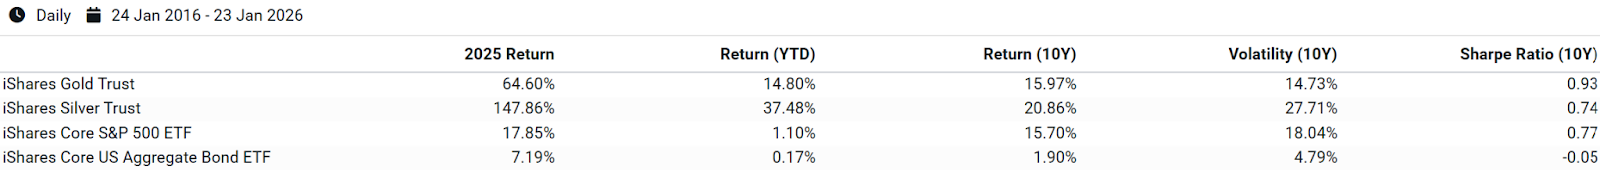
Source: Venn by Two Sigma
These metals are typically negatively correlated with the USD due to being priced in that currency. The dollar’s recent broad depreciation has led to higher demand. What's more, in a world where U.S. policy has cast doubt on typical safe-haven assets, the safe-haven role of Gold and Silver has been unquestioned.
This recent demand surge has made these precious metals top of mind when it comes to portfolio construction, but more structural due diligence may be needed for strategic decision making.
In this piece, we will quantify the fundamental drivers of Gold and Silver performance over the last decade using the Two Sigma Factor Lens, understanding both their similarities and differences. We will show how a majority of their risk and return is unexplained by our traditional risk factors, including our Commodities factor.
Which Factors Have Driven Gold and Silver Historically?
Below, we decompose Gold and Silver’s Exposure, Risk, and Return over the last decade using the Two Sigma Factor Lens.
Exhibit 2: Factor Decomposition of Gold and Silver
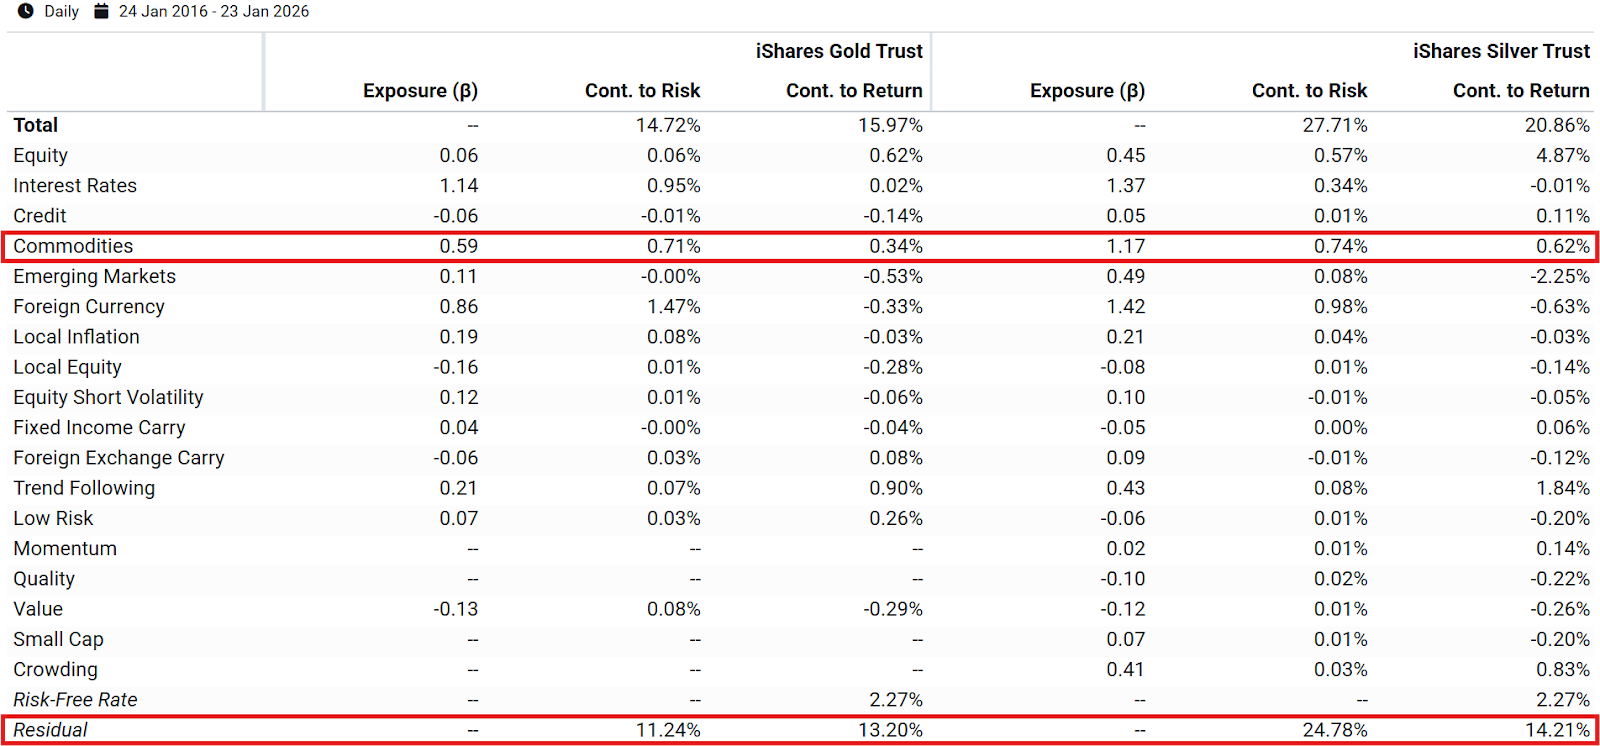 Source: Venn by Two Sigma
Exhibit 2 shows that Gold and Silver are only partially explained by common investment factors, with the most surprising finding being where they don't show up.
Most notably, our Commodities factor has contributed very little to the risk or return of either asset. This is likely surprising to some, and completely contradicts the asset-class classification of Gold and Silver. More on this in our next section.
What about other factors? Silver's industrial use cases have given it a meaningful equity beta of 0.45, contributing 4.87% to annualized return over the period. Gold, by contrast, has had near-zero equity beta. Other factors like Foreign Currency, Interest Rates, and Local Inflation tell intuitive but relatively modest stories.
The bigger question remains: if these traditional factors, including Commodities, haven’t been the dominant drivers of Gold and Silver, what has?
Residual: The Hidden Common Factor
Residual measures the risk that cannot be explained by our factor lens. It could represent noise, idiosyncratic risk, or an unknown or excluded systematic risk.
In the case of Gold, Exhibit 2 shows that residual represented volatility of 11.24%, or 76.35% of total vol. For Silver, it was 24.78%, or 89.45% of total vol.3 What’s more, the contribution to return from residual was overwhelmingly positive for both assets, contributing over 13% to annualized returns.
If residual risk is unique across both metals, they might be highly complementary. If a portion of residual risk is overlapping, it may be that there is a hidden systematic risk factor that investors may want to access. In either case, there is the potential to reveal a diversifying source of return to traditional sources, including commodities.
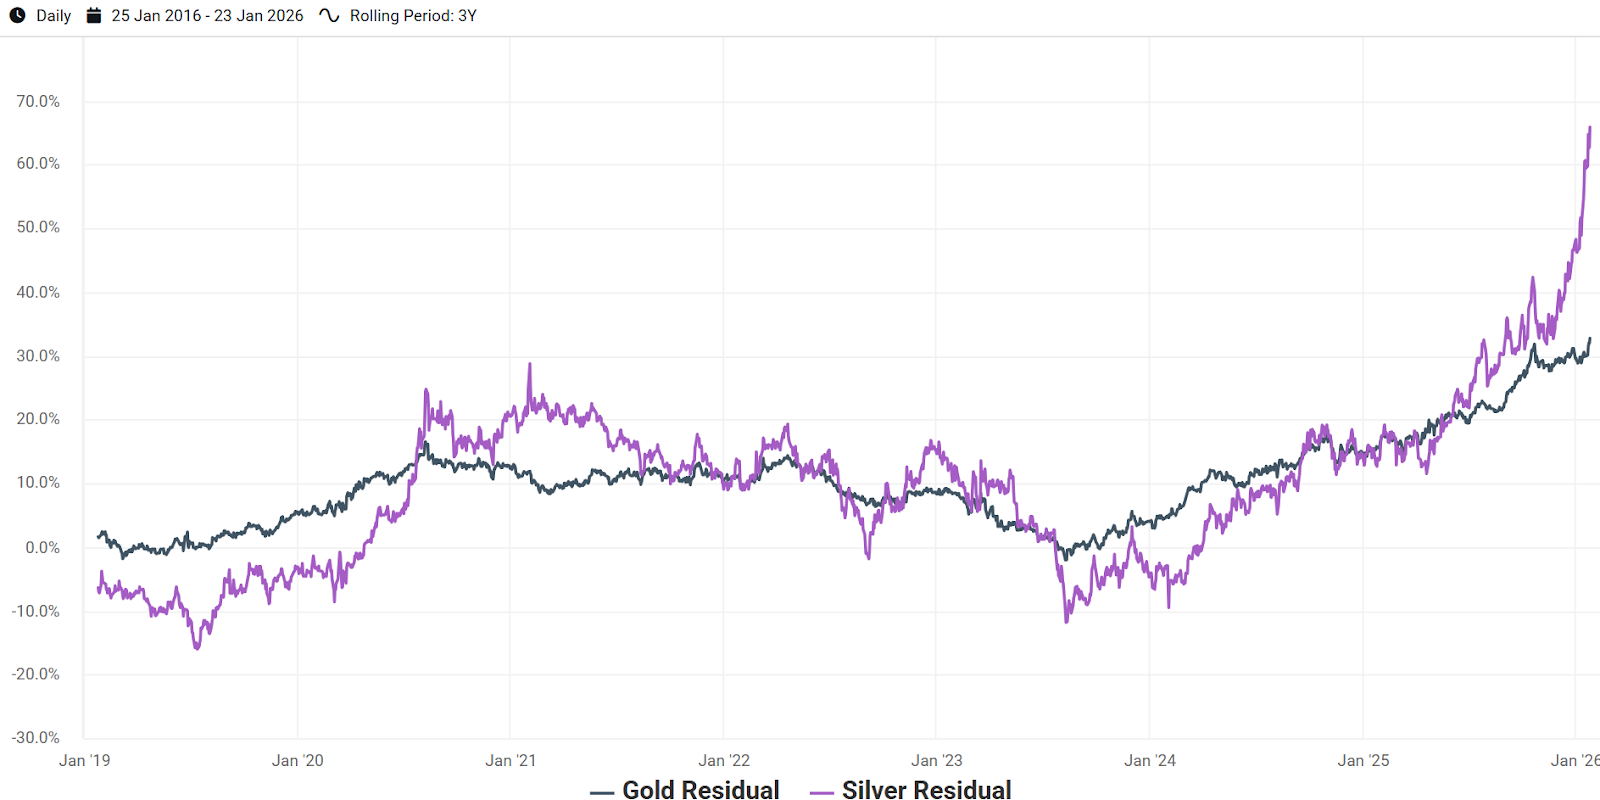
When looking at 3-year rolling returns for both Gold and Silver’s residual, the correlation becomes clear (Exhibit 3). More specifically, over the last decade they have had a residual correlation of 0.63.4 This strongly indicates that an unknown or excluded systematic factor makes up at least some portion of both metals’ residual return. In the case of Gold, its rolling 3-year residual return has very rarely dipped below zero, making it a consistent source of diversified positive return.
Exhibit 3: Rolling 3-Year Residual Return of Gold and Silver
 Source: Venn by Two Sigma
It is worth noting that the recent acceleration in residual return is significant for both Gold and Silver, and that allocators should be cautious about extrapolating recent performance. As always, past performance does not guarantee future results.
What This Means For a Total Portfolio Approach
Some might be tempted to assume they are getting the distinct benefits of Gold and Silver as part of their commodity sleeve. However, this asset-class-based understanding may seriously undermine the differentiation of Gold and Silver, and how they may affect total portfolio outcomes.
Take, for example, the factor decomposition of the Bloomberg Commodity Index side by side with Gold and Silver.
Exhibit 4: Factor Decomposition of a Commodity Index, Gold, and Silver
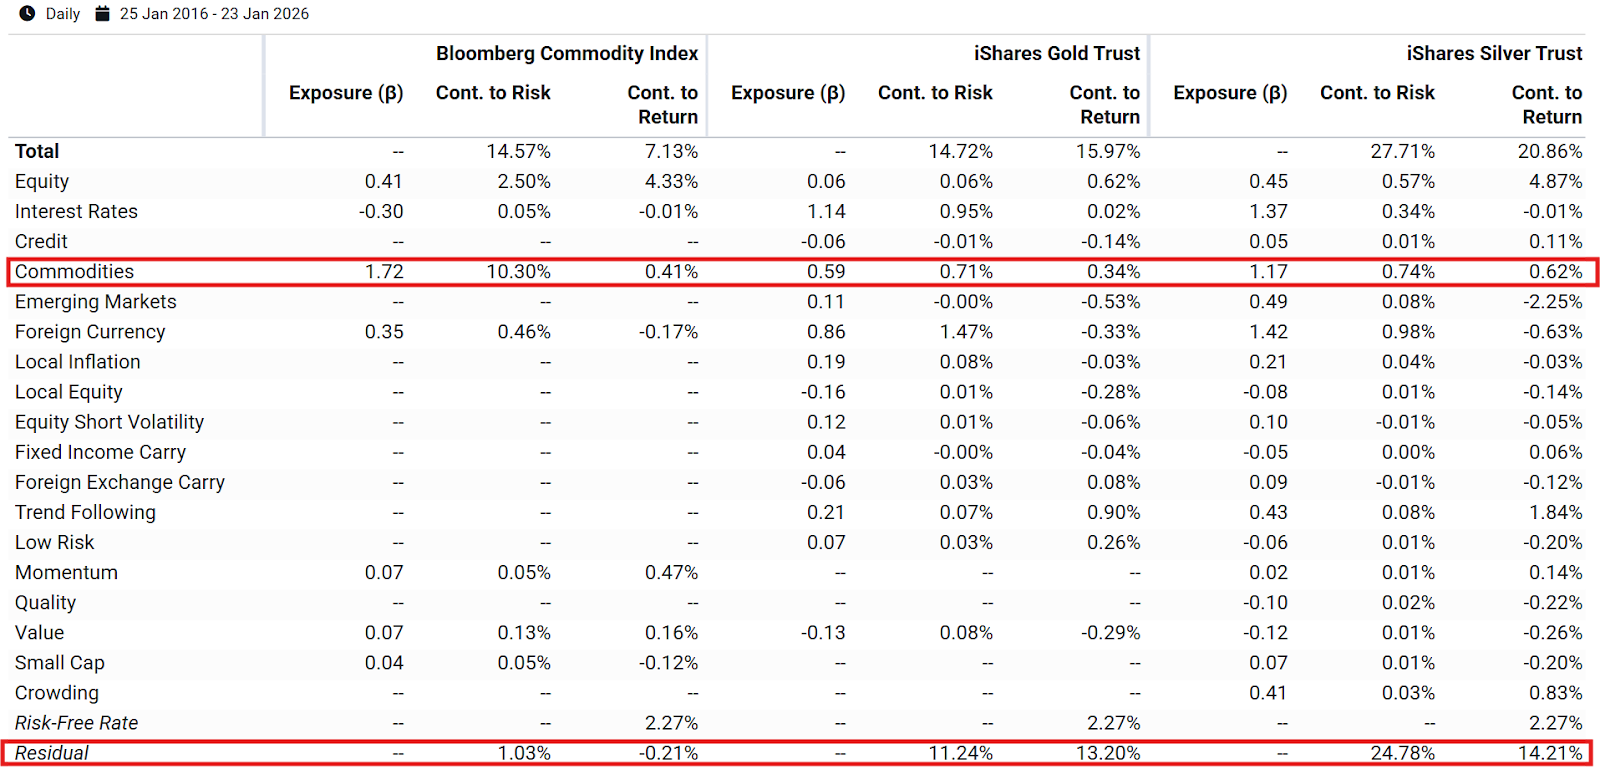
Source: Venn by Two Sigma
As we can see from Exhibit 4, the Two Sigma Factor Lens explains 10.30% of volatility for the commodity index, or 70.70% of total vol. Our Equity factor was the other primary contributor to risk. The commodity index only has 1.03% volatility from residual, resulting in a negative return contribution.
What makes these differences in factor output even more stark is that broad commodities exposure includes Gold and Silver allocations. For example, as of 12/31/2025, the commodity index we chose held 20.30% in Gold and 9.01% in Silver.5 This confirms that broad commodity exposure, inclusive of Gold and Silver, has produced an extremely different risk profile than Gold or Silver as standalone assets over the last decade.
Beyond the Commodity Label
For an allocator, within Venn’s framework, it’s important to acknowledge that our Commodities factor has historically not been rewarded. Since 1998, it has had an annualized return of -0.75%.
It’s also important to acknowledge that this factor hasn’t been a significant driver for Gold and Silver. Instead, Gold and Silver have offered access to a source of risk that behaves differently from what already dominates most institutional portfolios.
A meaningful portion of their residual risk is shared, suggesting exposure to a common systematic factor not captured by our lens. This could be a broader flight-to-quality dynamic, a premium specific to precious metals, or something else entirely.
For investors still allocating through asset classes, the differences in risk profile between broad commodities and Gold and Silver are critical to understand. For those taking a total portfolio approach, or allocating and thinking about their portfolio through the lens of fundamental risks, it's clear that Gold and Silver have provided something distinct from traditional risk factors.

References
1 As measured by the ETFs in Exhibit 1 that seek to track the physical commodities.
2 As measured by the Equity and Bond ETFs in Exhibit 1.
3 It is worth noting that Venn can also analyze trends in how residual contributed to overall risk. For both metals, residual has consistently been the primary driver. In the case of Silver, residual has consistently contributed 80% or more to the total risk of our analysis period, using 3-year periods for analysis and rolling them monthly. For Gold, its residual’s lowest contribution to overall risk was roughly 54% over the 3-year period ending in September, 2019.
4 We wanted to keep this blog focused on Gold and Silver, but other metals, such as Platinum, showed the same pattern. For example, measured by the abrdn Physical Platinum Shares ETC (PPLT), Platinum exhibited a residual correlation of 0.47 and 0.53 with Gold and Silver respectively over this period.
5 https://assets.bbhub.io/professional/sites/27/BCOM.pdf
Exposure to risk factors is not a guarantee of increased performance or decreased risk. References to the Two Sigma Factor Lens and other Venn methodologies are qualified in their entirety by the applicable documentation on Venn.
This article is not an endorsement by Two Sigma Investor Solutions, LP or any of its affiliates (collectively, “Two Sigma”) of the topics discussed. The views expressed above reflect those of the authors and are not necessarily the views of Two Sigma. This article (i) is only for informational and educational purposes, (ii) is not intended to provide, and should not be relied upon, for investment, accounting, legal or tax advice, and (iii) is not a recommendation as to any portfolio, allocation, strategy or investment. This article is not an offer to sell or the solicitation of an offer to buy any securities or other instruments. This article is current as of the date of issuance (or any earlier date as referenced herein) and is subject to change without notice. The analytics or other services available on Venn change frequently and the content of this article should be expected to become outdated and less accurate over time. Two Sigma has no obligation to update the article nor does Two Sigma make any express or implied warranties or representations as to its completeness or accuracy. This material uses some trademarks owned by entities other than Two Sigma purely for identification and comment as fair nominative use. That use does not imply any association with or endorsement of the other company by Two Sigma, or vice versa. See the end of the document for other important disclaimers and disclosures. Click here for other important disclaimers and disclosures.