


In the early 2000s recession—during the “Tech Bubble” and ensuing “Tech Crash”—the Technology sector reached roughly 33 percent weight in the S&P 500 Index. Today it has surpassed 35 percent, propelled by the rapid appreciation of AI‑related companies such as Nvidia, Microsoft, and other members of the “Magnificent Seven” (Exhibit 1).
Exhibit 1: S&P 500 Sector Composition Over Time, 1990–2025
 Source: Bloomberg. Period from 1990–2025.
Artificial intelligence is emerging much as the internet once did. Investors appear to be emphasizing its growth potential more than near‑term fundamentals, and related equity returns have been both thrilling and unsettling. Many investors are now asking whether we are witnessing another Tech Bubble, a question that invites a deeper look through a factor‑based lens.
In this analysis, we use the Two Sigma Factor Lens to examine the crash that followed the 2000’s Tech Bubble, identifying which institutional exposures were rewarded and which struggled. We then examine a hypothetical multi‑asset portfolio, showing how asset‑class diversification can still mask concentration in a single risk factor.
How the Tech Crash Looked Through the Two Sigma Factor Lens
We represent the Tech Crash by the peak‑to‑trough performance of the Invesco QQQ ETF, spanning March 27th, 2000 through October 7th, 2002.
Over this period, the drawdown proved far more isolated than often assumed. Viewed through the Two Sigma Factor Lens, which translates broad market performance into the most fundamental and independent market factors, nearly the entire decline was captured within our Equity factor.
Please see the appendix for additional commentary on individual factor performance.
Exhibit 2: Two Sigma Factor Lens Performance During the Tech Crash
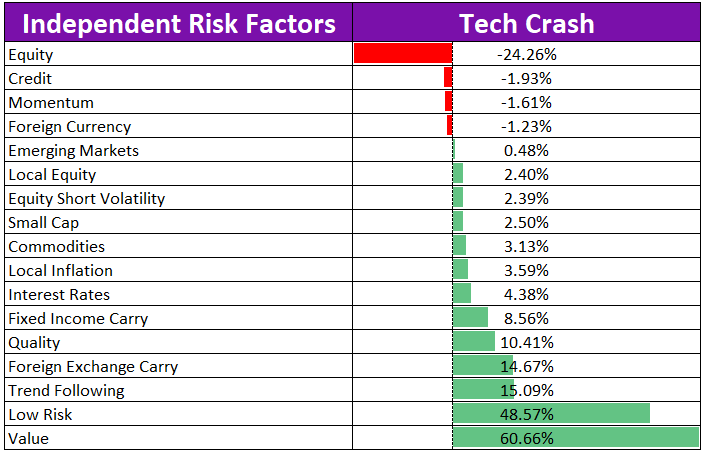 Source: Venn by Two Sigma. Period from 3/27/2000–10/7/2002.
Recognizing that the drawdown was largely confined to our Equity factor reinforces why many institutions are increasingly approaching portfolio construction through a factor-based framework. In theory, a portfolio with meaningful and balanced exposure across independent factors would have experienced a very different pattern of returns than a traditional 50/30/20 mix that remains dominated by equities. This is an idea we explore further in the next section’s case study.
It is important to understand that even among factors designed for long‑term independence, short‑term correlations can shift during periods of market stress. During the Tech Crash, however, the Two Sigma Factor Lens continued to show remarkably low correlations across factors.
Exhibit 3: Two Sigma Factor Lens Correlations During the Tech Crash
 Source: Venn by Two Sigma. Crowding excluded due to data availability. Period from 3/27/2000–10/7/2002.
Despite 15 of 16 factors posting only slightly negative to positive returns, the median correlation among them was just 0.01. This indicates that although most factors moved in the opposite direction of our Equity factor, they did so in unique ways.1
To us, this is a much more valuable insight than simply noting that most of these factors achieved positive returns. When allocators seek diversification, this is what they mean!
Case Study: What Did Asset Class Diversification Mean During the Tech Crash?
To understand how factor diversification can differ from asset-class diversification, we constructed a hypothetical 50/30/20 portfolio of 50% equities, 30% fixed income, and 20% alternatives, rebalanced quarterly (Exhibit 4). The composition reflects a mix commonly used by institutional allocators seeking additional diversification beyond a 60/40 structure.
Exhibit 4: Hypothetical 50/30/20 Portfolio

Source: Venn by Two Sigma. From top to bottom, representative indexes are: The S&P 500, MSCI EAFE, MSCI Emerging Markets, Bloomberg US Aggregate, Markit iBoxx USD Liquid High Yield, LBMA Gold Price, Bloomberg Commodity, DXY, and MSCI US REIT.
Exhibit 5 shows that, although diversified across asset classes, the portfolio exhibited meaningful exposure to only five of Venn’s factors during the Tech Crash. Most of that exposure was to the Equity factor, which contributed an annualized -13.12% percent to total return over the period. This finding highlights that even a portfolio appearing well diversified by asset classes can still have performance be primarily driven by a single underlying factor.
Exhibit 5: Two Sigma Factor Lens Output for a Hypothetical 50/30/20 During the Tech Crash
 Source: Venn by Two Sigma. Return streams for MSCI EAFE, MSCI Emerging Markets, Markit iBoxx USD Liquid High Yield, LBMA Gold Price, DXY, and MSCI US REIT sourced from Bloomberg.
For those seeking broader diversification within our framework, achieving more balanced exposure across multiple factors would be ideal. Given that most of Venn’s factors were neutral or positive during the Tech Crash, a portfolio with more balanced factor exposure might have experienced a smaller drawdown.
One way to accomplish factor diversification is by including managers or assets that offer differentiated factor exposures relative to an existing portfolio. Using the Two Sigma Factor Lens as a common language makes this a straightforward exercise for evaluating each manager’s contribution to overall portfolio risk and return.
For instance, if analyzing this portfolio today, an allocator might consider adding managers that introduce additional factors such as Value, Quality, Trend Following, or Carry to the total portfolio.
A Factor Framework for Modern Portfolio Construction
Constructing portfolios from a factor perspective helps reveal how many independent sources of return a portfolio truly captures, and whether those exposures are large enough to make a meaningful difference.
This approach doesn’t guarantee that every factor will deliver positive returns during a crisis, or even that long-term factor correlations will remain stable. Risk can never be eliminated in investing.
Yet, a factor perspective offers the deep understanding of diversification that some allocators may mistakenly believe they’re getting with asset classes. We believe our analysis of the Tech Crash, which mirrors several market themes now evident in AI‑driven markets, illustrates this point.
Whether the current AI-related enthusiasm ultimately resembles the early-2000s Tech Bubble or not, taking a total-portfolio approach, with a factor lens at its core, provides a grounded framework for portfolio construction and true diversification understanding. As AI’s influence grows, so does the value of viewing diversification through an independent factor lens.
For those looking to learn more about taking a factor-based click here.
Appendix: Getting More Specific on Equity Style Factor Performance
Equity styles were standout performers during the Tech Crash, prompting us to dive a little deeper.
Value and Low Risk: These factors were clear beneficiaries of the Tech Crash, returning an annualized 60.66% and 48.57% with volatilities of 15.30% and 18.44%, respectively. This resulted in Sharpe ratios of 3.18 and 2.24, well above the third highest achieved by Trend Following at 1.56.
Both are long/short exposures that, even outside of the Tech Crash, are typically net short the Technology sector because it tends to be relatively expensive and higher risk. While being net short Technology does not fully explain their performance, attribution confirms that Technology dynamics were the dominant positive contributor for both. In fact, these two factors exhibited the strongest correlation of any pair during the Tech Crash, at roughly 0.88 (Exhibit 3), effectively functioning as a single factor over this period.
Examining their three‑year rolling correlation highlights how unusual this level of co‑movement was. With that said, it is worth noting that their three‑year correlations have again begun to rise alongside today’s AI‑related market enthusiasm.
Exhibit 6: Rolling 3-Year Correlation Between Value and Low Risk, 1998–2025
 Source: Venn by Two Sigma. Period from 8/7/1998–10/20/2025.
Momentum: One might expect that Momentum would ride Tech performance higher just to be holding the proverbial “bag”. During the Tech Crash, however, the Momentum factor declined by only an annualized 1.61%.
Looking at Exhibit 7, you’ll see Momentum did in fact plunge as the bubble popped, but, given that the crash was a lengthy two years, it gave Momentum enough time to adjust its portfolio to begin benefiting from relative performance trends.
Exhibit 7: Momentum Performance During The Tech Bubble and Crash
 Source Venn by Two Sigma. Period from 3/27/2000–10/7/2002.
References
1Trend Following does show a strong negative Correlation to our Equity factor, but stronger short-term correlations are expected for this factor in particular. Trend Following takes directional bets in asset classes, so by definition, it can become correlated to these asset classes over the short term if they are trending in one direction. This makes Trend Following as a diversifier in portfolios a more strategic opportunity than a tactical one, as correlations can vary based on market trending behavior.
Exposure to risk factors is not a guarantee of increased performance or decreased risk.
References to the Two Sigma Factor Lens and other Venn methodologies are qualified in their entirety by the applicable documentation on Venn.
This article is not an endorsement by Two Sigma Investor Solutions, LP or any of its affiliates (collectively, “Two Sigma”) of the topics discussed. The views expressed above reflect those of the authors and are not necessarily the views of Two Sigma. This article (i) is only for informational and educational purposes, (ii) is not intended to provide, and should not be relied upon, for investment, accounting, legal or tax advice, and (iii) is not a recommendation as to any portfolio, allocation, strategy or investment. This article is not an offer to sell or the solicitation of an offer to buy any securities or other instruments. This article is current as of the date of issuance (or any earlier date as referenced herein) and is subject to change without notice. The analytics or other services available on Venn change frequently and the content of this article should be expected to become outdated and less accurate over time. Two Sigma has no obligation to update the article nor does Two Sigma make any express or implied warranties or representations as to its completeness or accuracy. This material uses some trademarks owned by entities other than Two Sigma purely for identification and comment as fair nominative use. That use does not imply any association with or endorsement of the other company by Two Sigma, or vice versa. See the end of the document for other important disclaimers and disclosures. Click here for other important disclaimers and disclosures.


.png)