
An August 2025 executive order aimed at expanding access to private assets for 401(k) investors is just one example of their growing influence1. Yet, despite this push for accessibility, private assets remain opaque with data that is difficult to obtain and analyze.
A few years ago, Venn introduced desmoothing, interpolation, and extrapolation to help users view private asset returns through a public lens. These techniques can help provide truer timing, more realistic volatility, daily frequency, and timelier valuations. However, they require time-weighted returns (TWRs), which are hard to come by.
In our view, the need for sophisticated processing on difficult-to-acquire data conflicts with promises of greater accessibility for private assets. To meet this challenge, we are introducing Venn Daily Private Asset Returns (VDPARs).
VDPARs represent hundreds of ready-to-use daily return streams available in Venn's data library, covering both broad private asset classes and vintage-specific cohorts2. Each return stream is unsmoothed and continuously updated, providing a data-driven way to represent and analyze private asset funds within a total portfolio.
Exhibit 1: VDPARs Enable a Total Portfolio Approach Across Private and Public Assets
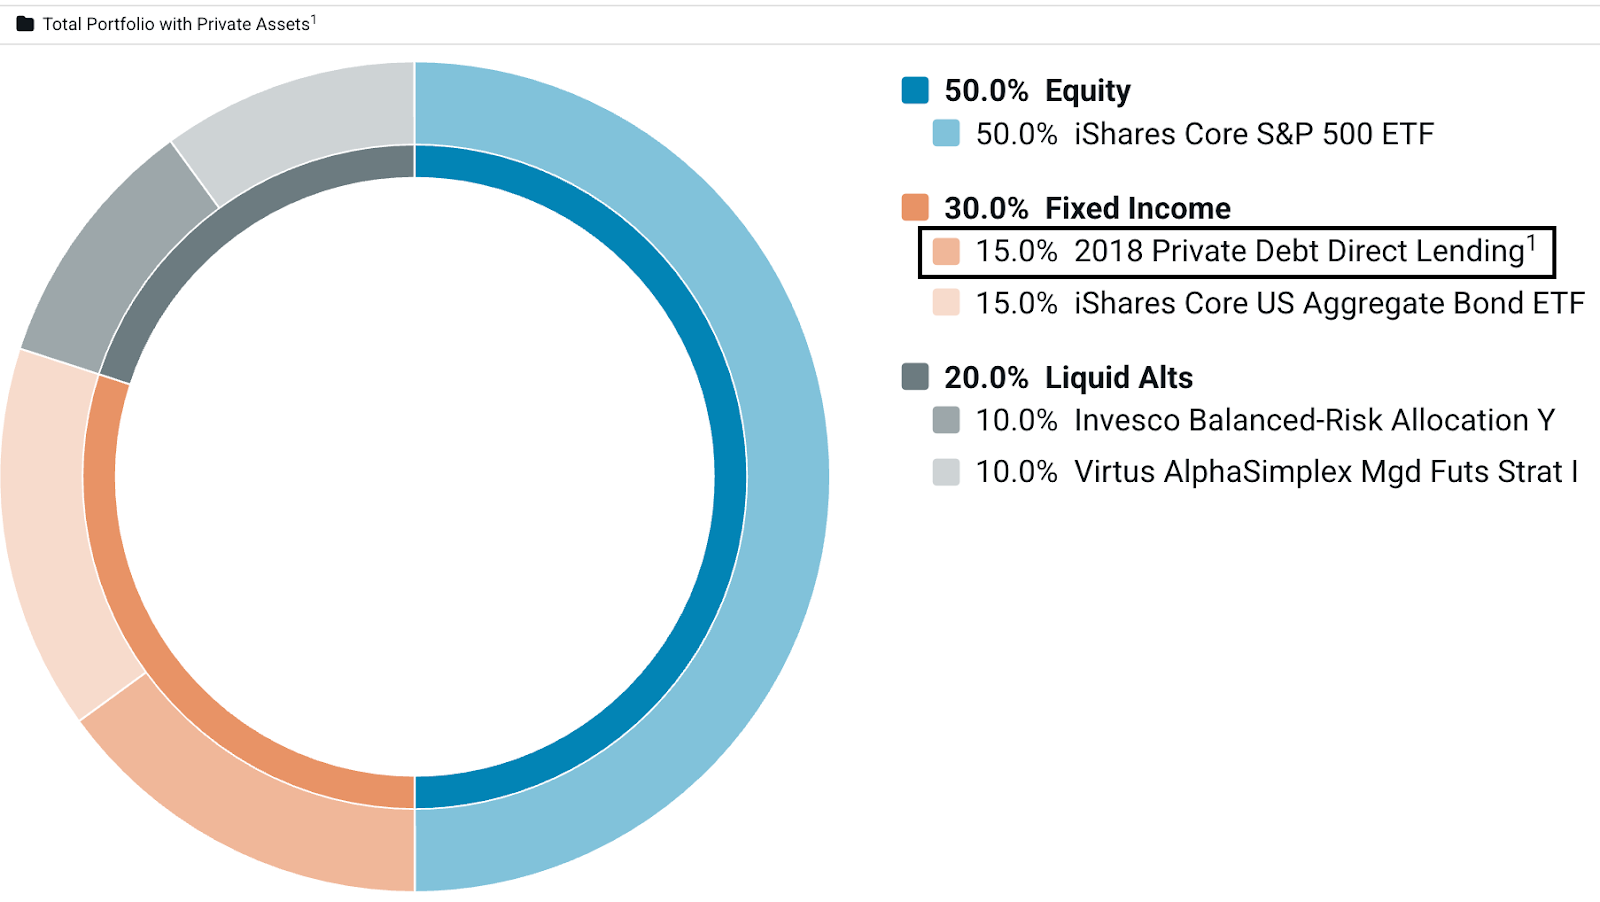
Source: Venn. For illustrative purposes only.1 Returns modeled using cohort cash flow data and a public market proxy.
In this piece, we will outline our methodology, review output, and demonstrate practical applications for portfolio analysis and reporting.
How VDPARs Are Built
Data Inputs
Traditional private asset returns rely on infrequent NAVs that are subject to timing lags and smoothing effects. VDPARs take a different approach by combining two objective and timely data sources:
- Fund Cash Flows: In our view, cash flows, the capital called from investors and distributed back to them, represent the most objective data available. They track real money movements rather than subjective NAVs.
- Public Market Proxy Returns: Private assets don't exist in isolation from broader economic forces. Private equity, debt, real estate, and other strategies are subject to many of the same market dynamics as their public counterparts. This suggests that public proxy returns provide valuable context for analysis.
To create VDPARs, we construct cohorts using cash flows of comparable private asset funds defined by vintage year, asset class, and strategy (for example, “2018 Private Debt Direct Lending”). However, because private asset data is inherently sparse, we may incorporate cash flows from earlier vintages when needed. This allows us to prioritize model robustness by leveraging cash flow data from similar funds, especially those with overlapping investment and distribution cycles3.
As a result, the targeted-vintage VDPAR is intended to be the best representative TWR for a vintage year, rather than a pure expression of that vintage’s standalone dynamics.
Return Construction Process
For each cohort, our methodology addresses a fundamental question: What relationship to public markets would make the present value of contributions (money in) equal the present value of distributions (money out)? To accomplish this, we find the β to a public proxy, and α, that brings the sum of individual fund net present values (NPV) closest to zero. We then apply these parameters to daily public proxy returns, as shown in Exhibit 2.
This new set of daily returns can be interpreted as the cohort's implied cost of capital.
Exhibit 2: Venn’s Daily Private Asset Return Methodology
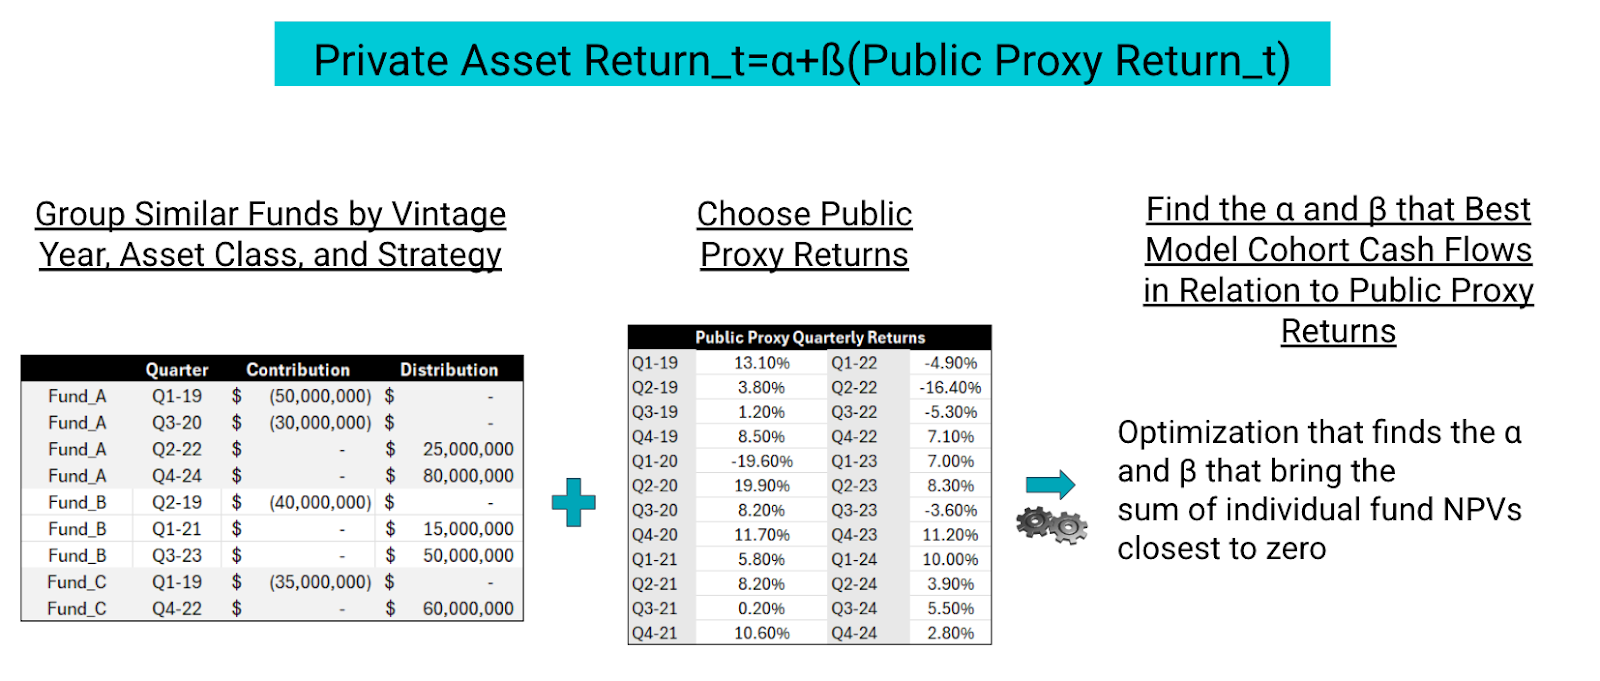 Source: Venn. For Illustration Purposes Only. As mentioned earlier, due to the sparse nature of private asset data, we allow for flexibility in the vintage year data used to create the Venn Daily Private Asset Return stream that best represents a target vintage year. Please see our help center documentation for more information.
Analyzing Real Estate Value Added Using VDPARs
The most powerful application of Venn Daily Private Asset Returns is to reflect a vintage cohort’s risk and return profile as part of a total portfolio, including factor-specific systematic risk.
In Exhibit 3, we compare the 2008, 2012, 2016, and 2020 vintage cohort returns of “Real Estate Value Added” over a ~25-year period to the SPDR Dow Jones REIT ETF (RWR) benchmark. These cohort returns are derived by applying the cash flow-informed β and α to the full return history of the public proxy, generating modeled returns that exist throughout the entire analysis period.
Exhibit 3: Performance and Risk of Real Estate Value Added Strategies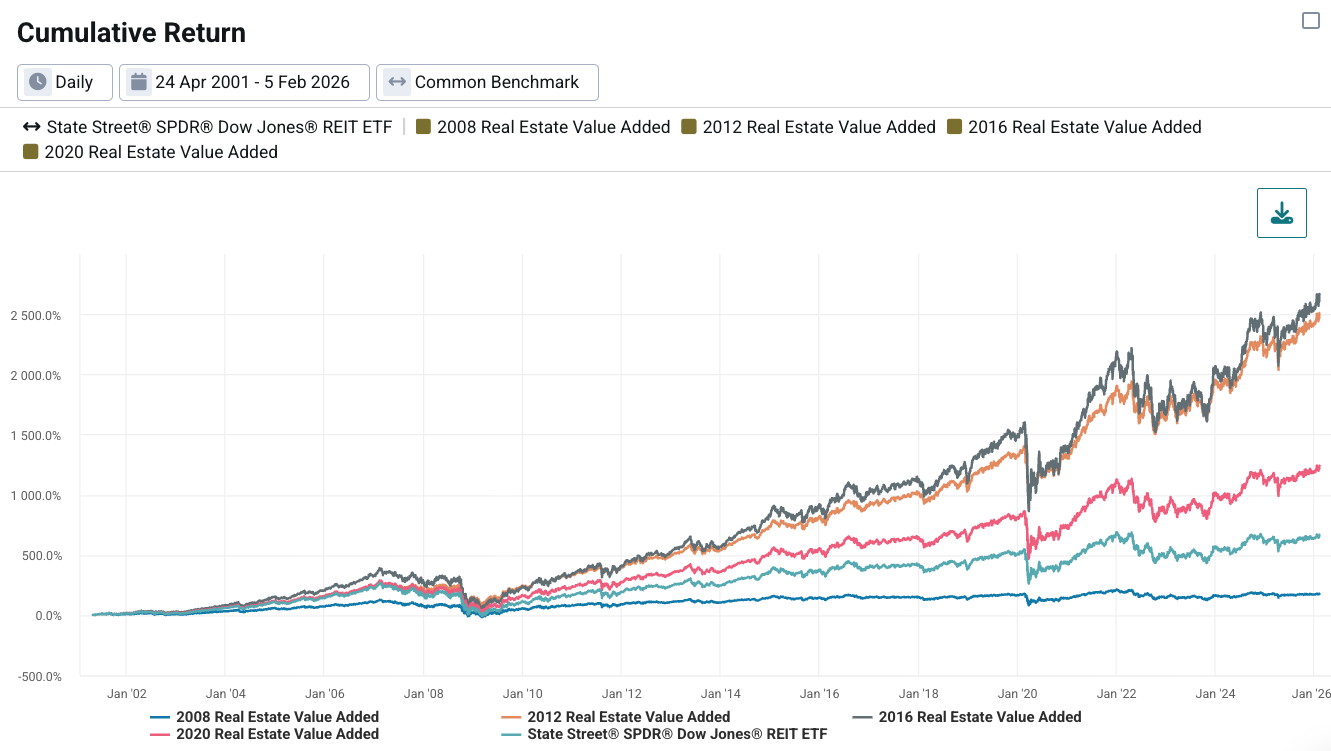
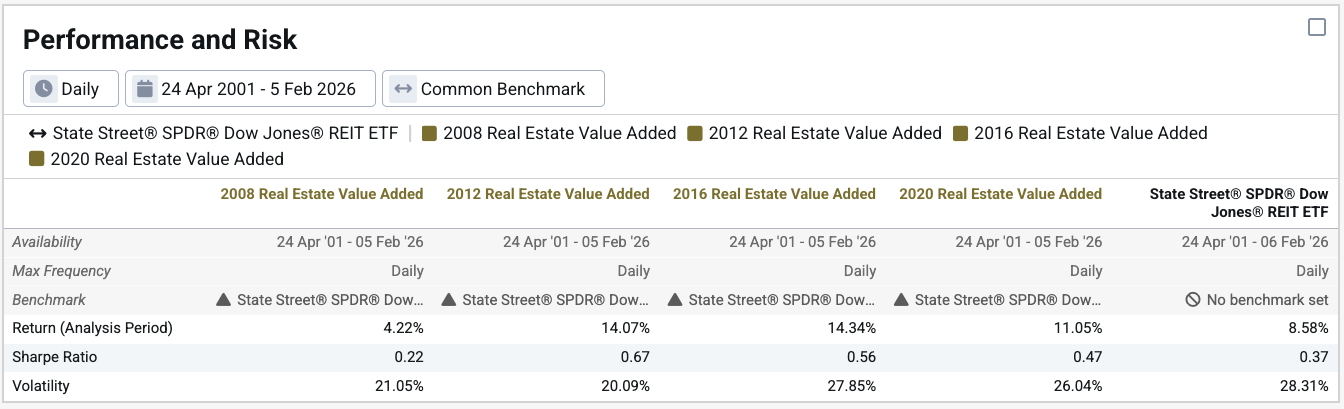 Source: Venn.
Summarizing findings:
- The 2008 vintage cohort returned an annualized 4.22%, underperforming the benchmark, which returned 8.58%.
- The 2012, 2016, and 2020 vintage cohorts each outperformed the public market benchmark, with 2012 and 2016 earning ~14% in annualized return and 2020 earning 11.05%.
These modeled returns also provide insights into how recent vintage profiles might have performed during historical market environments. For instance, all VDPARs shown are available during the Global Financial Crisis, including the most recent vintage. This can be valuable context for reporting or risk modeling that otherwise would be difficult to obtain due to data constraints.
But does the raw performance tell the whole story?
Factor Analysis of VDPARs
Below we translate the cash flow-informed β to the public proxy through Venn’s Factor Lens, allowing us to understand whether a cohort outperformed due to alpha (residual return) or systematic exposures.
Especially for active users of this feature, we suggest reading the associated footnote for detailed technical considerations4. (Reminder: you can click on images to enlarge them).
Exhibit 4: VDPARs Through the Two Sigma Factor Lens
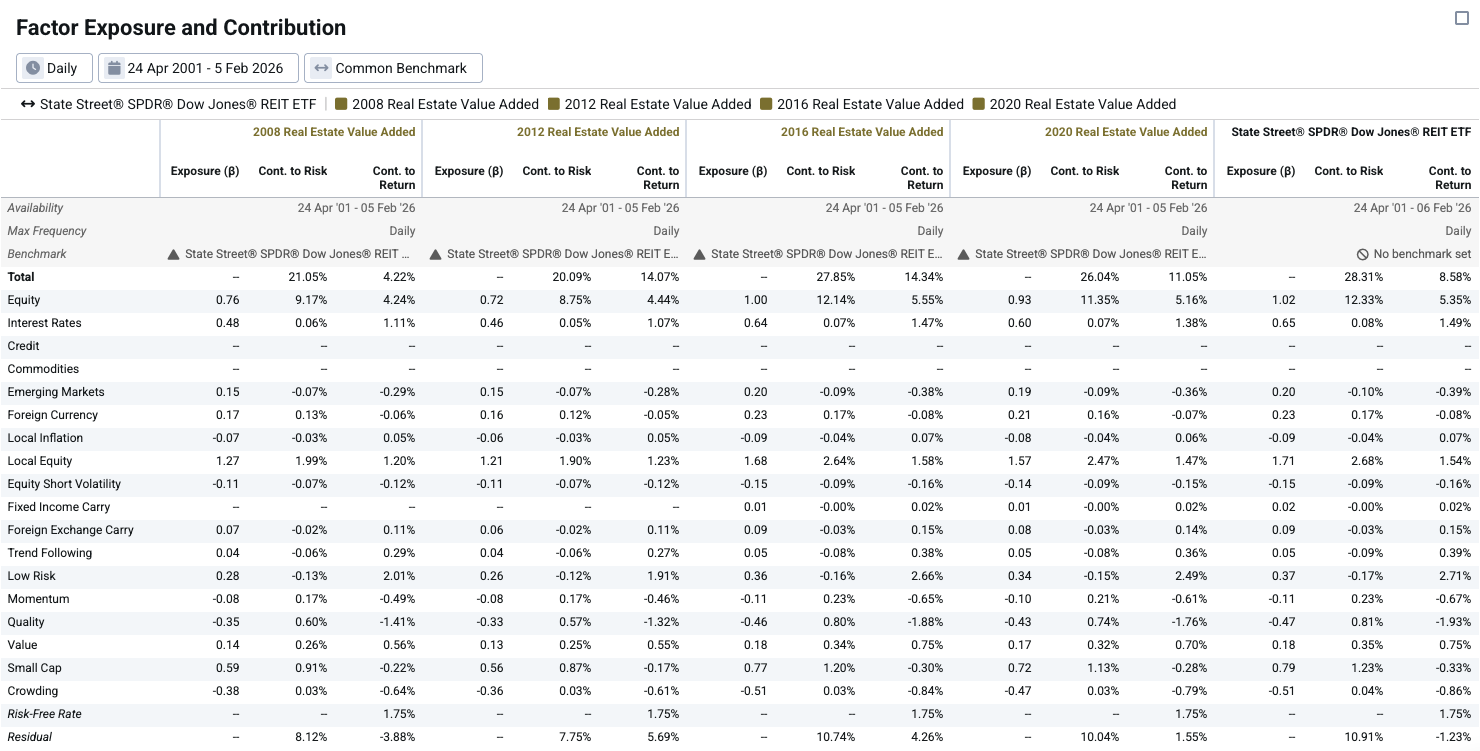
Source: Venn.
Summarizing findings:
- Overall, the recent vintage cohorts (2016 and 2020) had more pronounced factor betas than the older vintage cohorts (2008 and 2012).5
- The 2008 vintage cohort's residual contribution to return was negative. This indicates that this group of funds failed to generate value beyond their systematic exposures.
- Furthermore, while the 2012 and 2016 vintage cohorts achieved similar annualized returns (~14%), their drivers were meaningfully different.
- The 2016 vintage cohort had higher factor betas (1.00 equity exposure compared to 0.72 for the 2012 vintage cohort, for example), suggesting returns were more attributable to higher systematic exposure.
- On the other hand, the 2012 vintage cohort generated a higher residual contribution to return (5.69% vs 4.26%), indicating stronger manager skill, broadly.
- Lastly, the 2020 vintage cohort produced an annualized residual return of 1.55%. For some investors, this may imply that the cohort of funds used to generate this VDPAR did not add much value outside of the systematic exposure to the public proxy. Given the barriers to entry of private investments, this may suggest that easier access to liquid markets could offer comparable exposures.
VDPAR’s Role In A Total Portfolio Approach
Institutional investors are increasingly adopting a “Total Portfolio Approach”, which, in many ways, is simply the commitment to analyzing a total portfolio holistically using factor analysis. As we’ve discussed, private asset data is sparse, hard to acquire, and often requires sophisticated processing techniques to improve transparency. This can make factor analysis, and a true total portfolio approach, extremely hard to take from theory to practice.
Using VDPARs, there is now a seamless way to provide data-driven context for private assets alongside liquid investments, including factor analysis.
This can lead to insights, such as quantifying which assets drove the systematic or residual return of a total portfolio, inclusive of private assets, as illustrated in Exhibit 5.
Exhibit 5: Factor Contribution to Total Portfolio Return
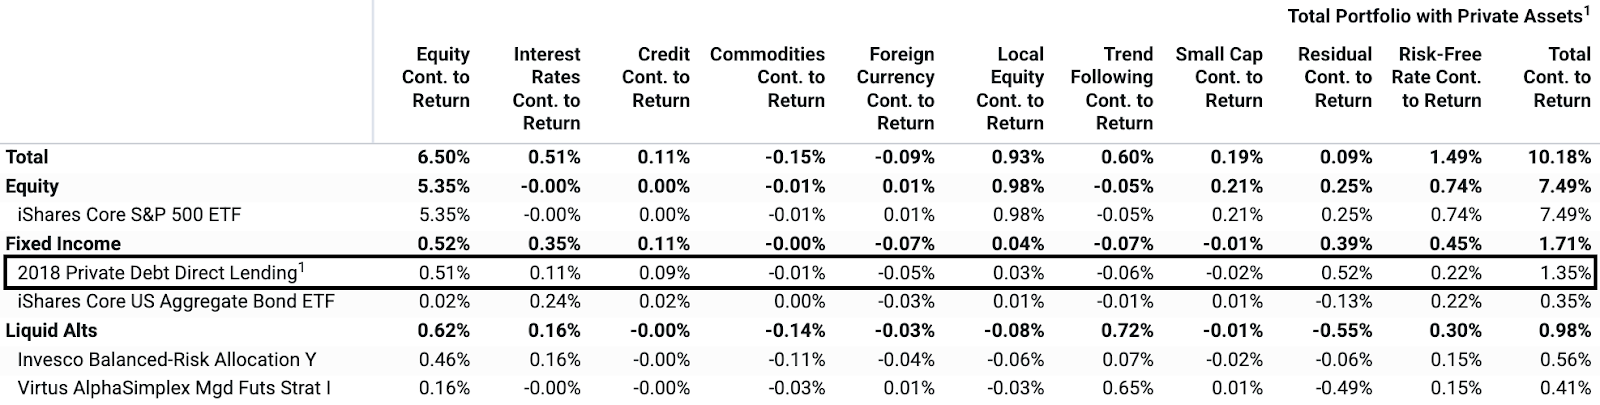
Source: Venn.For Illustrative Purposes Only. 1 Returns modeled using cohort cash flow data and a public market proxy.
Or the ability to report on a total portfolio through a liquid, daily, and up-to-date lens, using analytics and language familiar to your audience, as illustrated in Exhibit 6.
Exhibit 6: Total Portfolio Reporting Using VDPARs
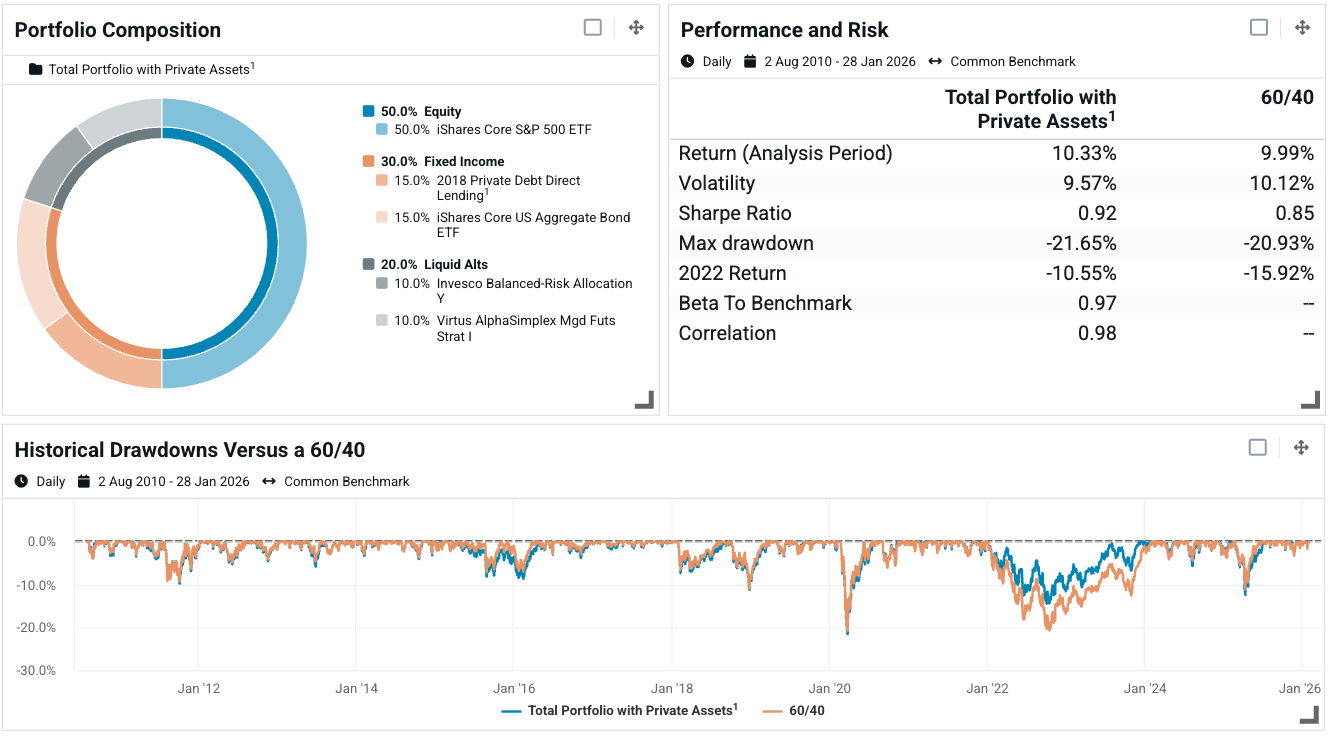
Source: Venn. For illustrative purposes only. 1 Returns modeled using cohort cash flow data and a public market proxy.
No matter the case, we believe technology will play an important role in bridging the gap between greater private asset accessibility and the transparency investors are accustomed to.
Venn Daily Private Asset Returns represent our continued dedication to deeper private asset insights as part of a total portfolio. Across multiple asset classes, and both liquid and illiquid investments, we aim to provide investors with an intuitive experience that is data-driven and designed to support total portfolio analysis, reporting, and communication.

References
2 Additional fees may apply for access to VDPARs.
3 Please see our help center documentation for more information.
4 (1) Using our model, estimated alpha is a constant daily adjustment (Exhibit 1). This means we do not capture the risk associated with a cohort's alpha. In reality, the manager's value-add likely varies over time with its own unique risk profile. (2) With that said, there is still residual risk present in Exhibit 4. This represents risk that is being carried through from the underlying public proxy. Some residual return will also be carried through from the public proxy. (3) As more cash flow data becomes available, VDPARs, and their historical returns, are subject to change.
5 You’ll notice that the factors selected are the same for all vintage cohorts. This means that vintage-specific cash-flow dynamics are captured in the magnitude of the factor exposures (impacted by β to the public proxy) and the residual returns (α), not in the factors selected.
Exposure to risk factors is not a guarantee of increased performance or decreased risk. References to the Two Sigma Factor Lens and other Venn methodologies are qualified in their entirety by the applicable documentation on Venn.
This article is not an endorsement by Two Sigma Investor Solutions, LP or any of its affiliates (collectively, “Two Sigma”) of the topics discussed. The views expressed above reflect those of the authors and are not necessarily the views of Two Sigma. This article (i) is only for informational and educational purposes, (ii) is not intended to provide, and should not be relied upon, for investment, accounting, legal or tax advice, and (iii) is not a recommendation as to any portfolio, allocation, strategy or investment. This article is not an offer to sell or the solicitation of an offer to buy any securities or other instruments. This article is current as of the date of issuance (or any earlier date as referenced herein) and is subject to change without notice. The analytics or other services available on Venn change frequently and the content of this article should be expected to become outdated and less accurate over time. Two Sigma has no obligation to update the article nor does Two Sigma make any express or implied warranties or representations as to its completeness or accuracy. This material uses some trademarks owned by entities other than Two Sigma purely for identification and comment as fair nominative use. That use does not imply any association with or endorsement of the other company by Two Sigma, or vice versa. See the end of the document for other important disclaimers and disclosures. Click here for other important disclaimers and disclosures.