-1.png)
On February 28th, the U.S. revealed what would be the beginning of an ongoing military conflict with Iran. It triggered historic volatility across global energy markets and forced investors, central banks, and policymakers to rapidly reassess the macro landscape.
In this report, we highlight Q1 2026 factor performance that was in the top or bottom 20th percentile of each factor’s full history (Exhibit 1 in orange).
In addition, to capture the quarter's two-act character, we supplement our standard performance exhibit with a sub-period analysis that separates the “before” period from “after” the U.S. president revealed military action with Iran on February 28th.1
Understanding which portfolio risks remained resilient or even benefited from that announcement is important context for both the last quarter and future ones, if the conflict continues.
Exhibit 1: Venn’s Factor Lens Performance in Q1 2026
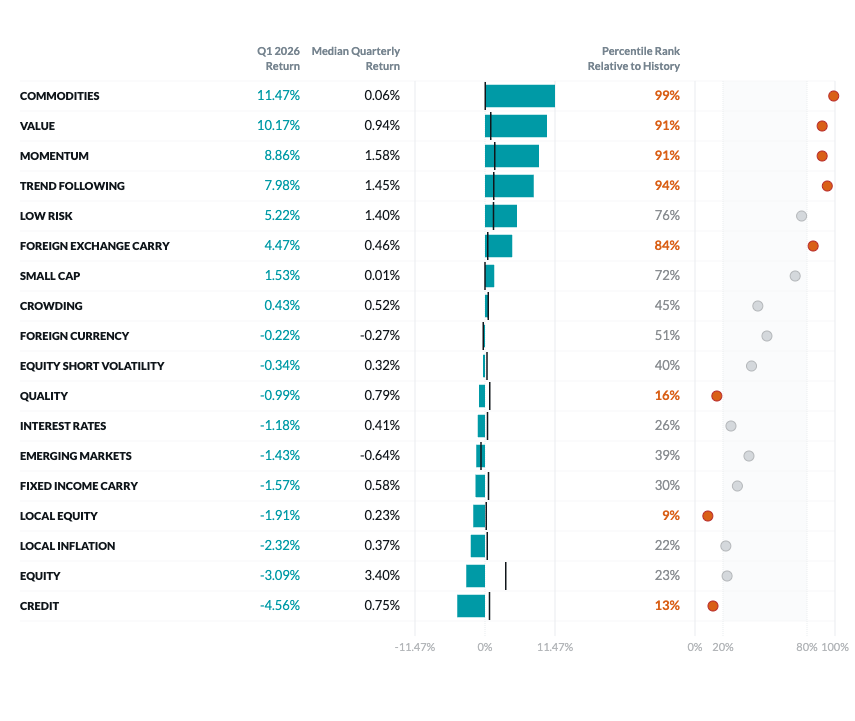
Two Sigma Investments, LP. This image is for informational purposes only. See https://www.venn.twosigma.com/blog-disclaimer for more disclaimers and disclosures.
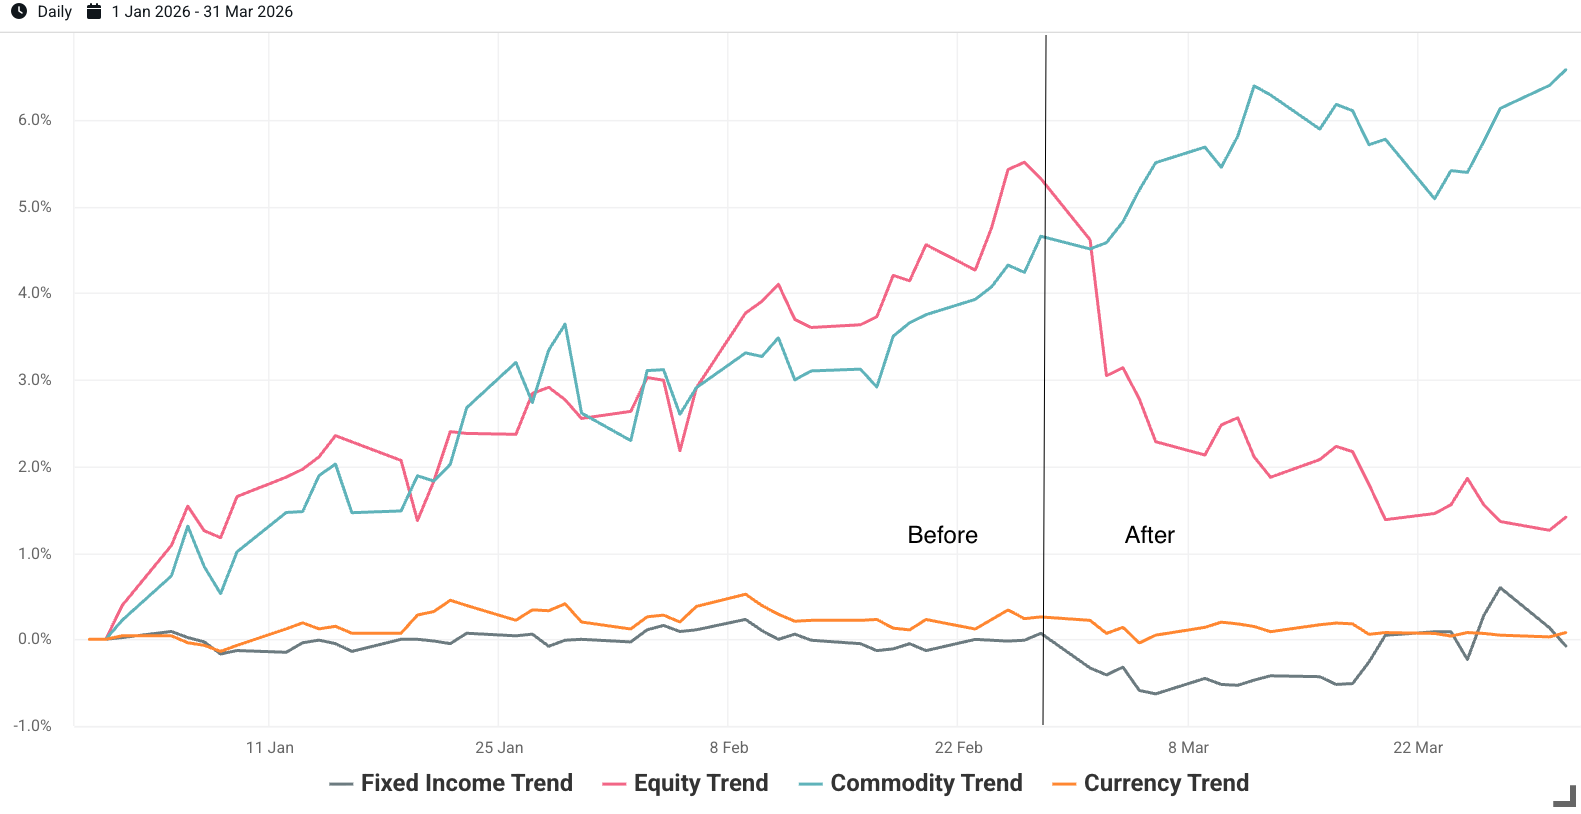
Exhibit 2: Venn’s Factor Lens Performance Before and After The U.S. Announcement
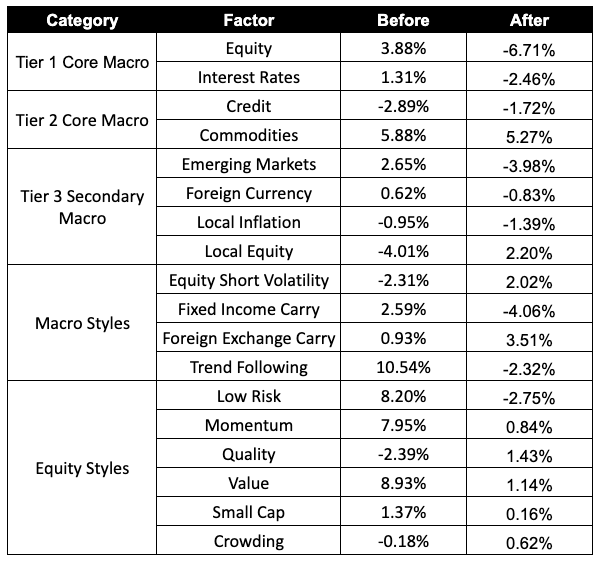
Source: Source: Venn. The announcement was made on Saturday, 2/28/2026. The “Before” period captures 1/1/2026 to 2/27/2026 and the “After” period captures 3/1/2026 to 3/31/2026.
Core Macro: Equity and Interest Rates factors both reversed course in the period after the U.S. president’s announcement, turning meaningfully negative. These are the only Tier 1 factors in our lens, meaning we believe them to be truly central when it comes to understanding institutional portfolio risk.
Typically these factors are used to balance each other in portfolios due to their low or negative correlation. If they fall together, it implies lower global economic growth alongside rising interest rates. When this occurs, as it did in 2022, it makes diversified factor exposure even more important for investors.
When looking at rolling 6-month correlations in Exhibit 3, we can see a slightly negative correlation between these two factors to start the quarter. However, their correlation has continued to rise with a distinct jump following the U.S. announcement, ending the quarter with a 6-month correlation above 0.40.
Exhibit 3: Rolling 6-Month Correlation of Venn’s Equity and Interest Rates Factors
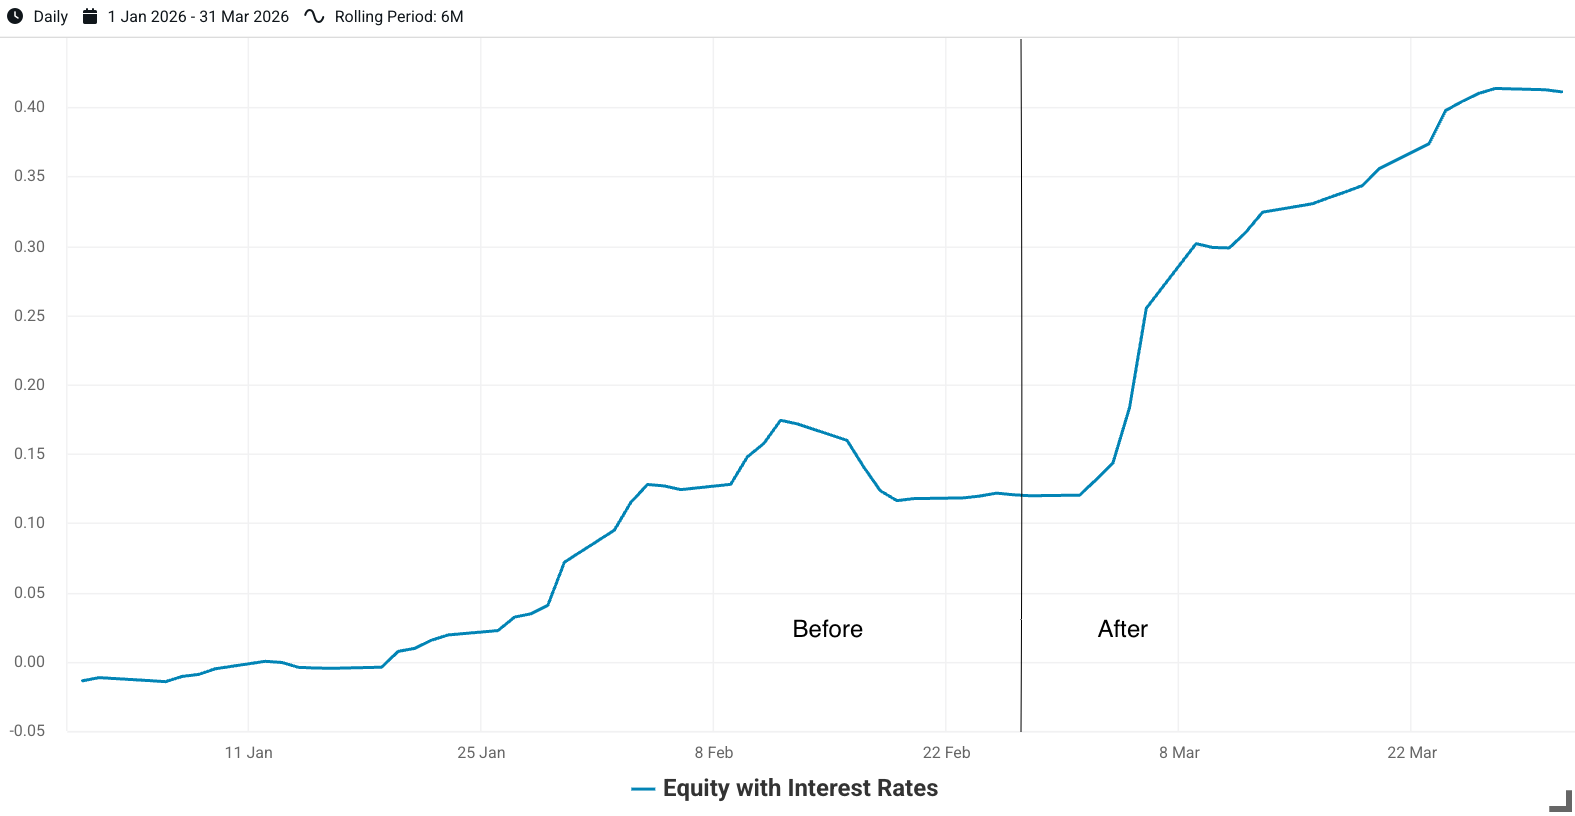
Source: Venn.
Secondary Macro: We consider Credit and Commodities Tier 2 macro factors, meaning they are residualized with both Equity and Interest Rates factors. This design aims for a purer measure of risk and return, beyond what’s correlated with higher tier factors.
Credit was negative throughout the quarter, which was true in both the period before and after the announcement. This suggests concerns regarding developed bond default risk have been growing alongside geopolitical tensions, and the official announcement of U.S. military conflict served to accelerate that trend. Exposure to our Credit factor has been a persistent headwind for institutional investors this quarter.
Investors have been rewarded for Commodities factor exposure virtually the entire quarter as geopolitical tensions slowly rose. Once conflict was revealed on the 28th, it climbed higher alongside individual commodities such as crude oil. It is worth noting that our Commodities factor has not been a rewarded exposure historically, capturing an annualized -0.52% return since 1998. Given its recent exceptional performance, institutional allocators may want to contextualize the current market environment alongside longer-term trends.
Exhibit 4: Q1 2026 Cumulative Return of Venn’s Credit and Commodities Factors
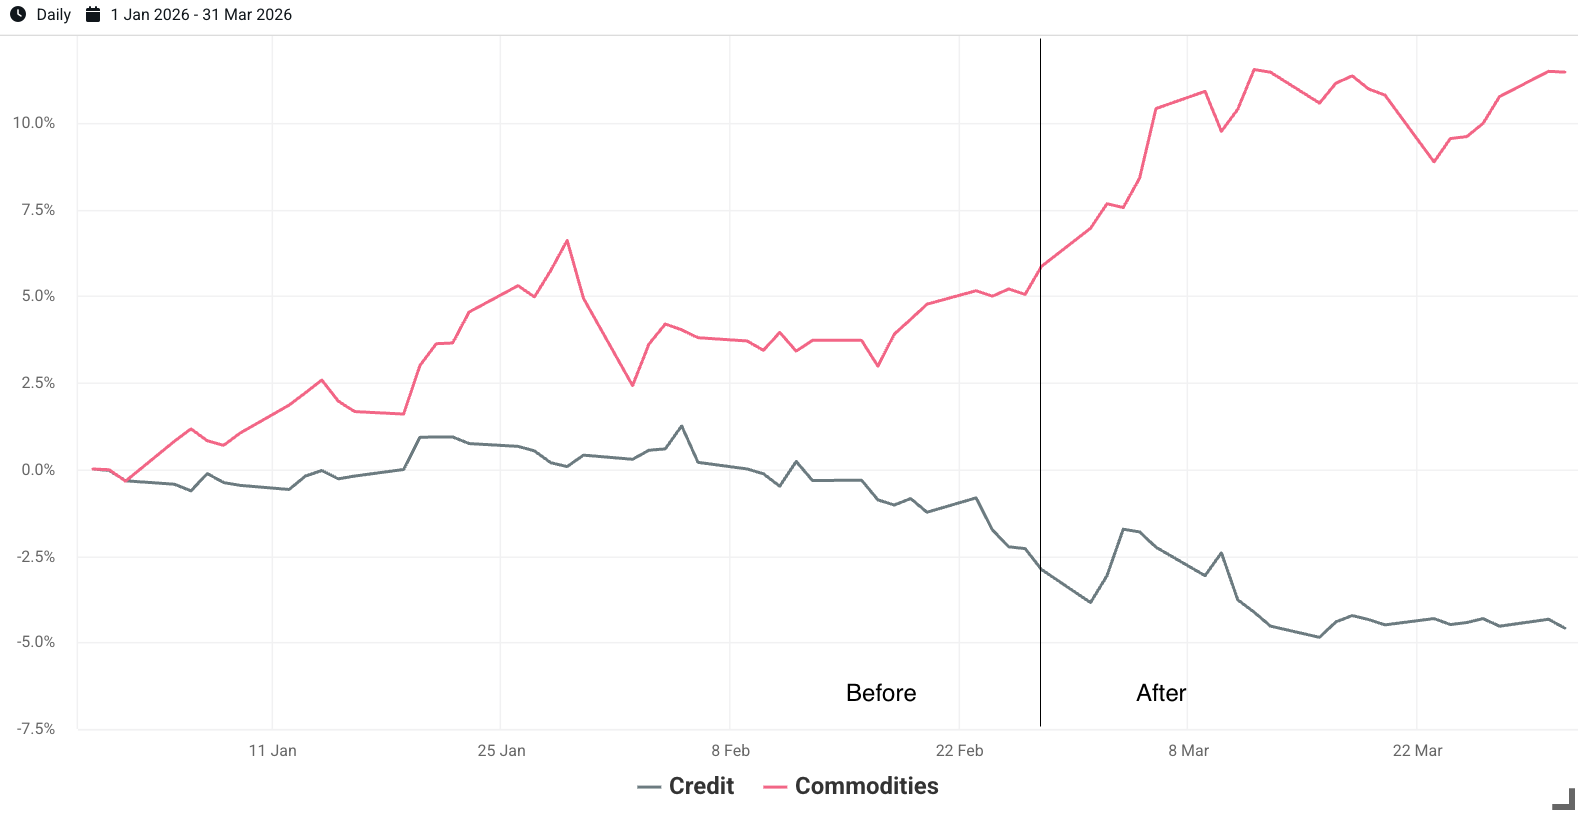
Source: Venn.
Secondary Macro: Venn’s Emerging Markets factor aims to capture pure EM risk, uncorrelated with Equity, Interest Rates, Credit, and Commodities factor risk. Especially when considering recent volatility of typically correlated factors, such as Commodities, the value of isolating pure Emerging Market exposure becomes even more important for evaluating total portfolio risk. As both Exhibits 2 and 5 show, EM exposure went from a tailwind to a headwind once the U.S. military conflict was announced and investors began seeking less risky exposures.
Another secondary macro factor, Local Equity, measures home bias risk in portfolios. Historically, positive exposure to U.S. home bias has been a tailwind for investors, but as our blog discussed, it has recently become a drag on return. However, negative performance reversed after the U.S. announcement. This was likely due to themes such as U.S. energy independence, a strong dollar, and physical distance from the military conflict. For those exhibiting home bias in portfolios, it is worth evaluating the more structural trends that previously led to negative returns for this factor, such as tariffs and U.S. isolationism, versus views on the current military conflict and how long it may continue.
Exhibit 5: Q1 2026 Cumulative Return of Venn’s Emerging Markets and Local Equity Factors
Source: Venn.
Macro Styles: This category aims to capture the typical institutional portfolio risks taken when seeking excess returns within the macro landscape. All macro styles exhibited meaningful movements between before and after periods.
The most pronounced difference was in our Trend Following factor, which performs well when trends of individual asset classes are robust and indicative of future performance. Before the conflict, this factor was up over 10%. In fact, over the full quarter, it returned almost 8%, registering as one of its best quarters in its history.
However, it’s clear that its positioning, informed by the six and twelve month period before the U.S. announcement, was sub-optimal for the “after” period, as it was down 2.32%. Examining sub-portfolio contributions, the commodities sleeve was the main driver of positive return. As we discussed earlier, commodities were performing well both before and after the U.S. military announcement, leading to a more successful trend strategy in this asset class in Q1. This sleeve helped to dampen the negative return from equity trend, which fell in the period after the announcement.
Exhibit 6: Q1 2026 Contribution to Return of Trend Following’s Sub-Portfolios
Source: Venn. Individual sub-portfolios are designed to sum on any given day to the Trend Following factor’s total return. This exhibit shows the cumulative return of these individual series. Due to compounding, they will not sum to Trend Following’s total return over the full quarter.
Equity Styles: Venn’s Equity Styles aim to capture the common risks institutional investors take to harvest equity risk premia. They are designed to be market neutral and thus independent of our Equity factor. Five of six Equity Style factors were positive during the period after the U.S. announcement, continuing to add value to institutional portfolios with exposure. Only Low Risk generated negative returns in the after period.
The Low Risk factor exploits leverage-constrained investors who systematically overprice high-beta stocks. The strategy levers up underpriced low-beta longs against high-beta shorts to capture this mispricing. The strategy is acutely vulnerable to sudden volatility spikes, which can escalate security borrowing costs and disrupt essential funding lines. Margin calls can force simultaneous selling of low-beta longs and covering of high-beta shorts, and as correlations spike and beta estimates go stale, the market-neutral hedge itself becomes exposed, inverting the premium further.
As shown in Exhibit 7, Low Risk dropped most meaningfully right after the announcement, but began a recovery towards the end of the quarter.
Exhibit 7: Q1 2026 Cumulative Return of Venn’s Low Risk Factor
Source: Venn.

References
1 Note that this announcement was made on a Saturday, so the “before” period captures 1/1/2026 to 2/27/2026 and the “after” period captures 3/1/2026 to 3/31/2026.
Exposure to risk factors is not a guarantee of increased performance or decreased risk. References to the Two Sigma Factor Lens and other Venn methodologies are qualified in their entirety by the applicable documentation on Venn.
This article is not an endorsement by Two Sigma Investor Solutions, LP or any of its affiliates (collectively, “Two Sigma”) of the topics discussed. The views expressed above reflect those of the authors and are not necessarily the views of Two Sigma. This article (i) is only for informational and educational purposes, (ii) is not intended to provide, and should not be relied upon, for investment, accounting, legal or tax advice, and (iii) is not a recommendation as to any portfolio, allocation, strategy or investment. This article is not an offer to sell or the solicitation of an offer to buy any securities or other instruments. This article is current as of the date of issuance (or any earlier date as referenced herein) and is subject to change without notice. The analytics or other services available on Venn change frequently and the content of this article should be expected to become outdated and less accurate over time. Two Sigma has no obligation to update the article nor does Two Sigma make any express or implied warranties or representations as to its completeness or accuracy. This material uses some trademarks owned by entities other than Two Sigma purely for identification and comment as fair nominative use. That use does not imply any association with or endorsement of the other company by Two Sigma, or vice versa. See the end of the document for other important disclaimers and disclosures. Click here for other important disclaimers and disclosures.