
What Are Safe Havens Assets?
When financial markets are in crisis like they were during the Global Financial Crisis of 2008, investors tend to flock to assets that they consider safe and high quality. These “safe-haven” assets are those that have tended to perform well in volatile market environments. When most investments are sinking, these assets tend to maintain their value, appreciate, or otherwise outperform during crises. However, what might have been considered a safe haven in one market crisis might not be in the next, and it’s hard to know ex-ante which assets will behave as safe havens in future market crises. Despite this uncertainty, investors have developed a sense of which assets might behave as safe havens over time. In this post, we examine five safe-haven assets and evaluate their performance during the 2022 stock market plunge.
How Are We Defining the 2022 Stock Market Plunge?
The causes of 2022 market volatility including high global inflation, rising rates and the war in Ukraine are still at play at the time of this publication. However, we define the dates for the 2022 stock market plunge specifically as Jan 5th to October 12th, 2022. This is intended to represent the hardest and sharpest part of our Equity Factor’s decline, down -22.94%. We chose the global equity market to determine our period of analysis because (1) market volatility has been global in nature, and (2) equity risk dominates most portfolios.
Exhibit 1: Venn’s Equity Factor During the 2022 Stock Market Plunge
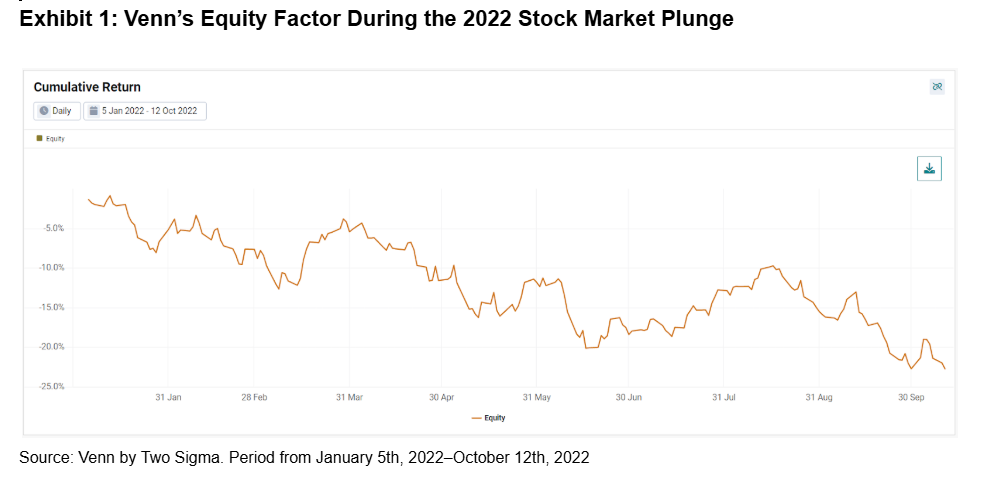
Source: Venn by Two Sigma. Period from January 5th, 2022–October 12th, 2022
1. Government Bonds
Developed market sovereign bonds are arguably the most canonical example of a safe-haven asset because of their lower realized volatility relative to stocks and the high expected creditworthiness of their issuers (developed market governments). However, it is no secret that equities and bonds have significantly increased their correlation recently, including during the 2022 stock market plunge.
Exhibit 2 shows the increasing rolling 1-year correlation between our Equity Factor and currency hedged global 7-10 year treasury bonds (Venn’s Interest Rates Factor).1
Exhibit 2: Rolling 1-Year Correlation of Equities and Interest Rates Factors
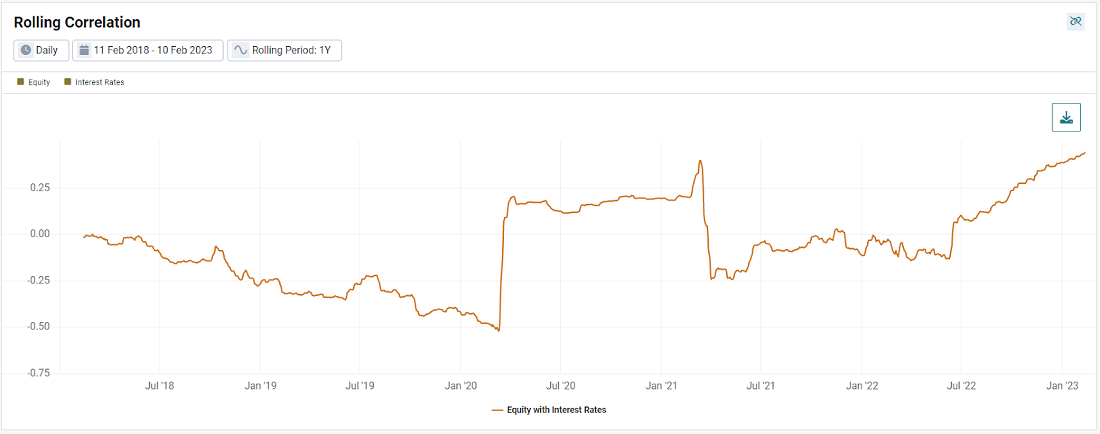
Source: Venn by Two Sigma. Equities represented by our Equity Factor and Bonds represented by our Interest Rates Factor. These factors are represented by currency hedged MSCI ACWI and currency hedged Bloomberg Barclays Global Treasury 7-10 Year Indexes, respectively. Period shown is trailing 5-years.
Before looking at 2022, it is worth noting the jump in correlation between equities and bonds that occurred as the Covid crisis began in 2020. This higher correlation also had a steep drop-off when that shock rolled off one year later. Since that time, correlation between equities and bonds has steadily risen to 0.44, higher than it has been since 1997.
During the 2022 stock market plunge, our Equity factor was down -22.94%, while our Interest Rates Factor was down -12.13%. This is not the diversification investors were presumably hoping for from two historically negatively correlated factors, especially for those implementing a risk parity strategy.
Exhibit 3: Equities and Interest Rates During the 2022 Stock Market Plunge
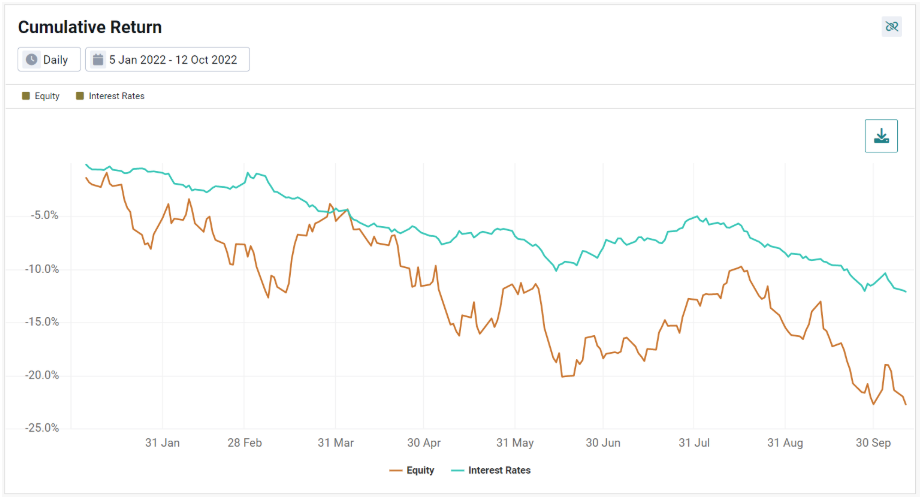
Source: Venn by Two Sigma. Equities represented by our Equity Factor and Bonds represented by our Interest Rates Factor. These factors are represented by currency hedged MSCI ACWI and currency hedged Bloomberg Barclays Global Treasury 7-10 Year Indexes, respectively.
2. Gold
Many consider gold, a precious metal, to be an attractive asset to hold in portfolios for a variety of reasons:
- Its liquid market makes it relatively easy to buy and sell.
- It is a hard asset with real world uses and has served as a traditional medium of exchange.
- It provides a source of diversification to equity-dominant portfolios (gold’s historical average 1-year rolling correlation with our Equity Factor is ~0.08).2
- Historically, it has performed well in market selloffs (for example, gold returned over 20% during the sharpest decline of the Global Financial Crisis: September 15, 2008 - March 9, 2009).
Although gold did not provide the same level of relief during the 2022 stock market plunge that it did during the Global Financial Crisis, its -7.9% return outperformed equity markets. In this way, it did act as a “successful” safe haven, however, there is more worth noting. While it’s true that gold outperformed equities, it acted as a drag on return for commodities broadly. For example, commodities without precious metals were up 21.62% over this period.3 So in this specific environment, investors would have been better off with a more diversified basket of commodities as their safe-haven investment rather than gold alone.
As shown in Exhibit 4, gold’s performance reversed course after rallying through March 8th. That initial rally was driven by the escalating conflict between Russia and Ukraine.4 In fact, from March 9th onward, gold fell more than our Equity Factor, down -18.19% compared to -11.76%. This was likely driven by the market beginning to price in the Fed's hiking cycle, as well as meaningful strengthening of the U.S. Dollar. Rising rates increase the opportunity cost of holding gold, a yield-less asset, as well as a strengthening Dollar lowering gold demand due to it being a Dollar-denominated commodity.
Exhibit 4: Equities and Gold During the 2022 Stock Market Plunge
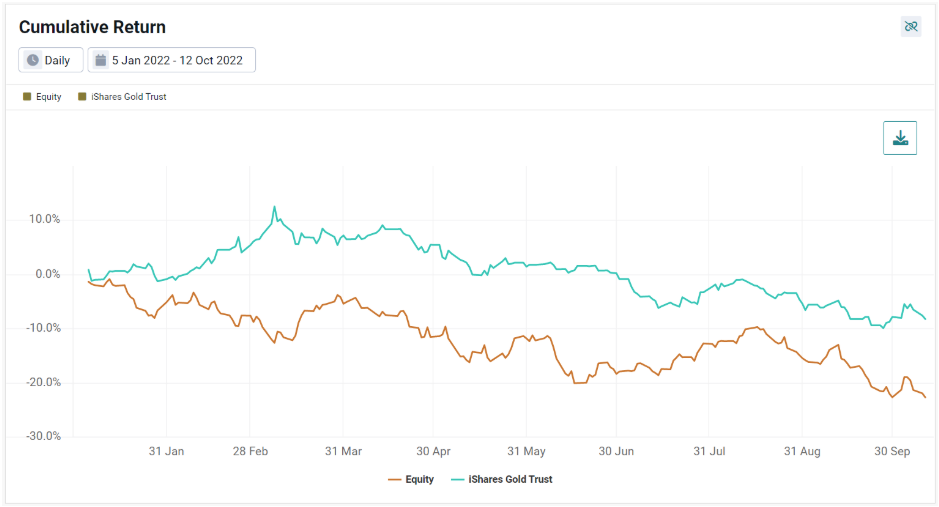
Source: Venn by Two Sigma. Equity represented by our Equity Factor or currency hedged MSCI ACWI. Gold represented by iShares Gold Trust (IAU).
3. Currencies
We’ll explore three currencies: the U.S. Dollar, Japanese Yen, and Swiss Franc, which investors have traditionally considered to be safe havens. This is because they have a mix of characteristics that make them attractive to hold in times of market uncertainty. These include:
- The backing of a stable political system.
- The backing of a country or region with strong finances and economic growth prospects.
- Liquid markets.
- The tendency for foreign governments to hold the currency in reserves.
- High confidence in the creditworthiness of the country or region that issues it.
Exhibit 5 displays the performance of the three currencies, using JPY and CHF/USD exchange rates and a U.S. Dollar index for the USD.5 The path of depreciation for JPY/USD over this period of volatility was particularly meaningful. JPY had been showing weakness relative to the dollar since 2021, but accelerated this trend about a month into the 2022 stock market plunge. In fact, this marked a 32-year low for the Japanese Yen versus the U.S. Dollar.6 The Yen faced a headwind due to its central bank’s yield control policy,7 increasing yield differentials with the world as rates rose globally.
Given that we are viewing the non-USD currencies relative to the Dollar, it was highly unlikely for all three of our safe-haven currencies to outperform at the same time, but nonetheless, over this period the Dollar was the clear winner, up 17.76%.
Exhibit 5: Currencies During the 2022 Stock Market Plunge
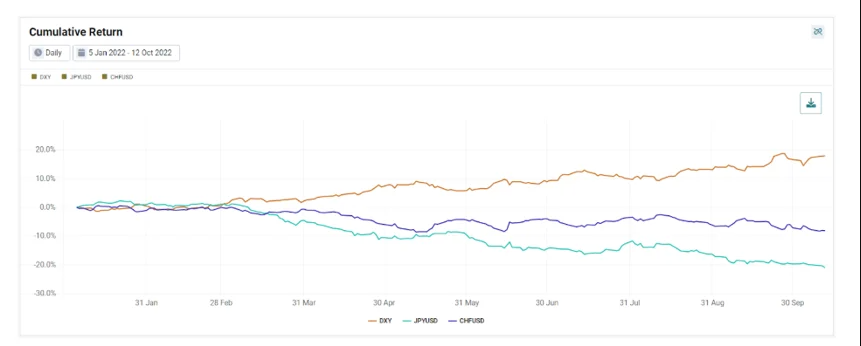
Source: Venn by Two Sigma, Bloomberg. USD represented by the U.S. Dollar Index (DXY). JPY and CHF are represented by JPY/USD and CHF/USD exchange rates, respectively.
4. “Defensive” Equity Sectors
While stocks typically might not be considered safe-haven assets, certain pockets of the equity market might be expected to outperform during market turmoil. Some examples include sectors such as Utilities, Consumer Staples, and Healthcare. The thinking here is that no matter the state of the markets, people will still need to access electricity, gas, and power. People will still be purchasing staple items like food (and toilet paper, as we’ve learned during the Covid market crisis!). People will still need access to health care. Did these three sectors hold up during the 2022 stock market plunge? As seen in the chart below, all three defensive sectors outperformed the global equity market on a relative basis.
Exhibit 6: Global Equity Sectors Relative to MSCI ACWI
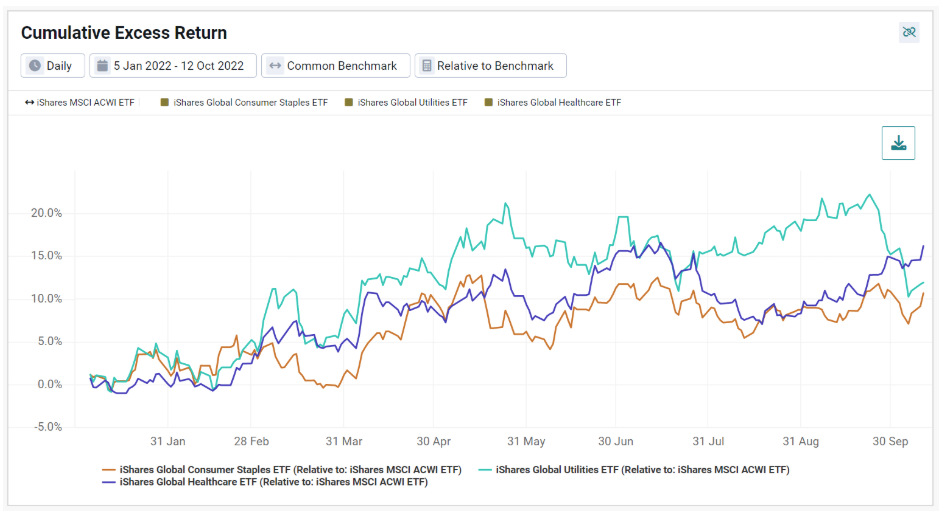
Source: Venn by Two Sigma. Sectors are represented by their respective iShares Global ETFs. Returns are relative to the iShares MSCI ACWI ETF.
5. Bitcoin
Finally, bitcoin, a digital currency, is considered by some to be a safe-haven asset in that it is decentralized and isn’t at risk of being seized or inflated by a government. However, a case could be made against bitcoin’s safe-haven label as the market for bitcoin is highly speculative and unregulated. The cryptocurrency also does not represent a claim on any underlying hard asset, is not backed by a sovereign government entity, and similar to gold is yieldless. The case to reconsider its safe haven status became even stronger during the 2022 stock market plunge as bitcoin fell significantly. Using Venn’s cryptocurrency reference rates, exhibit 7 shows an almost 60% drop in bitcoin during this period.
Exhibit 7: Bitcoin During the 2022 Stock Market Plunge
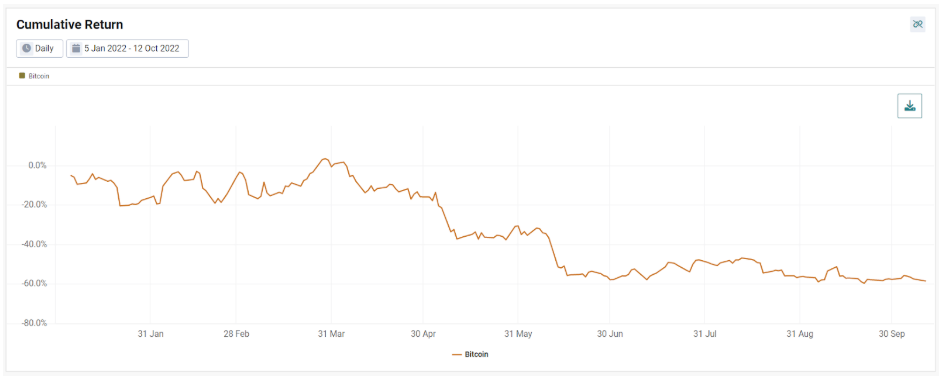
Source: Venn by Two Sigma. Bitcoin using Venn’s reference rates.
Going back to 2010, the correlation between equities and bitcoin is among the highest it’s been in history.
Exhibit 8: Rolling 1-Year Correlation of Equities with Bitcoin
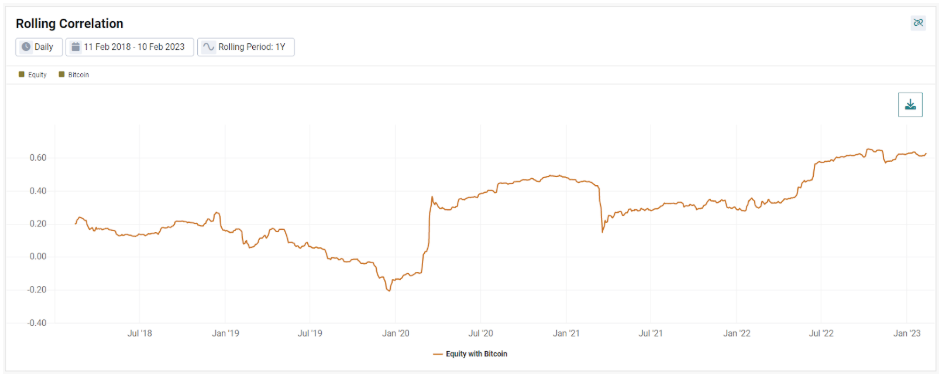
Source: Venn by Two Sigma. Period shown is trailing 5-years.
Summing Up Safe Haven Assets
Safe-haven assets are defined as those that maintain their value, appreciate, or otherwise outperform when financial markets crumble. However, a safe-haven asset isn’t guaranteed to produce positive returns in all market downturns. Here we examined five types of potential safe-haven assets and how they fared during the worst period for equity markets in 2022.
We found some of these safe havens held up notably better than the global equity market during the 2022 stock market plunge. Gold, the USD, and defensive equity sectors generated positive relative returns overall, while others, such as bonds and certain non-USD currencies were down. Bitcoin saw the worst performance of any of the “safe-haven” assets over this period, experiencing a -58.53% drawdown.
While all of this ex-post analysis is helpful in that it provides us with an understanding of asset performance during this market volatility, it unfortunately doesn’t help investors predict which assets will outperform in the next market crisis. We believe that every market crash is unique and the safe-haven assets that emerge in the next crash will likely depend on the specific conditions of that market crisis.
We previously wrote about five safe-haven assets performance during the Covid crisis in 2020. This post built on that piece, but was updated to instead analyze the stock market plunge in 2022. You can find more on safe-haven assets by reading Mike Nigro’s thoughts on “What is the Ultimate Safe Haven Investment.”
References
1 While global treasury bonds will include emerging market countries, we believe this is a directionally fair proxy for developed sovereign bonds due to the small percentages that emerging market countries would represent. For example, the S&P Global Developed Sovereign Bond Index was down -12.66% during the 2022 stock market plunge. Source: https://www.spglobal.com/spdji/en/indices/fixed-income/sp-global-developed-sovereign-bond-index/#overview
2 Here and throughout this piece any data related to “gold” refers to the iShares Gold Trust (IAU) as a proxy for the gold asset class.
3 Measured by Bloomberg Commodity Index ex-Precious Metals
4 https://www.barrons.com/articles/gold-futures-price-51646649750
5 Specifically the U.S. Dollar Index (DXY)
7 https://www.reuters.com/markets/asia/how-does-japans-yield-curve-control-work-2023-01-16/
8 Earnings and Investment quality were positive over this period.
This article is not an endorsement by Two Sigma Investor Solutions, LP or any of its affiliates (collectively, “Two Sigma”) of the topics discussed. The views expressed above reflect those of the authors and are not necessarily the views of Two Sigma. This article (i) is only for informational and educational purposes, (ii) is not intended to provide, and should not be relied upon, for investment, accounting, legal or tax advice, and (iii) is not a recommendation as to any portfolio, allocation, strategy or investment. This article is not an offer to sell or the solicitation of an offer to buy any securities or other instruments. This article is current as of the date of issuance (or any earlier date as referenced herein) and is subject to change without notice. The analytics or other services available on Venn change frequently and the content of this article should be expected to become outdated and less accurate over time. Any statements regarding planned or future development efforts for our existing or new products or services are not intended to be a promise or guarantee of future availability of products, services, or features. Such statements merely reflect our current plans. They are not intended to indicate when or how particular features will be offered or at what price. These planned or future development efforts may change without notice. Two Sigma has no obligation to update the article nor does Two Sigma make any express or implied warranties or representations as to its completeness or accuracy. This material uses some trademarks owned by entities other than Two Sigma purely for identification and comment as fair nominative use. That use does not imply any association with or endorsement of the other company by Two Sigma, or vice versa. See the end of the document for other important disclaimers and disclosures. Click here for other important disclaimers and disclosures.
This article may include discussion of investing in virtual currencies. You should be aware that virtual currencies can have unique characteristics from other securities, securities transactions and financial transactions. Virtual currencies prices may be volatile, they may be difficult to price and their liquidity may be dispersed. Virtual currencies may be subject to certain cybersecurity and technology risks. Various intermediaries in the virtual currency markets may be unregulated, and the general regulatory landscape for virtual currencies is uncertain. The identity of virtual currency market participants may be opaque, which may increase the risk of market manipulation and fraud. Fees involved in trading virtual currencies may vary.