
Venn’s factor analysis can quickly decompose the risk and return drivers of total portfolios using only their time series of returns. This capability is especially effective for analyzing opaque strategies, such as hedge funds, which often use sophisticated techniques such as leverage and shorting.
In response to client demand, Venn now addresses leverage and shorting more directly by allowing investors to model short positions and cash borrowing, while continuing to access detailed factor attribution through the Two Sigma Factor Lens. Venn does this by allowing negative allocations directly within the portfolio construction workflow.
To demonstrate this new functionality, we analyze two well-known strategies: a levered 60/40 allocation and a 130/30 equity strategy. We examine how leverage and shorting affect their risk, return, and importantly, their factor exposures.
Analyzing a Levered 60/40 Strategy
The classic 60/40 portfolio is popular due to its perceived balance of risk and return, but it may not always meet investors’ return targets. One way to maintain the 60/40 allocation while boosting exposure is by borrowing cash to invest additional capital.
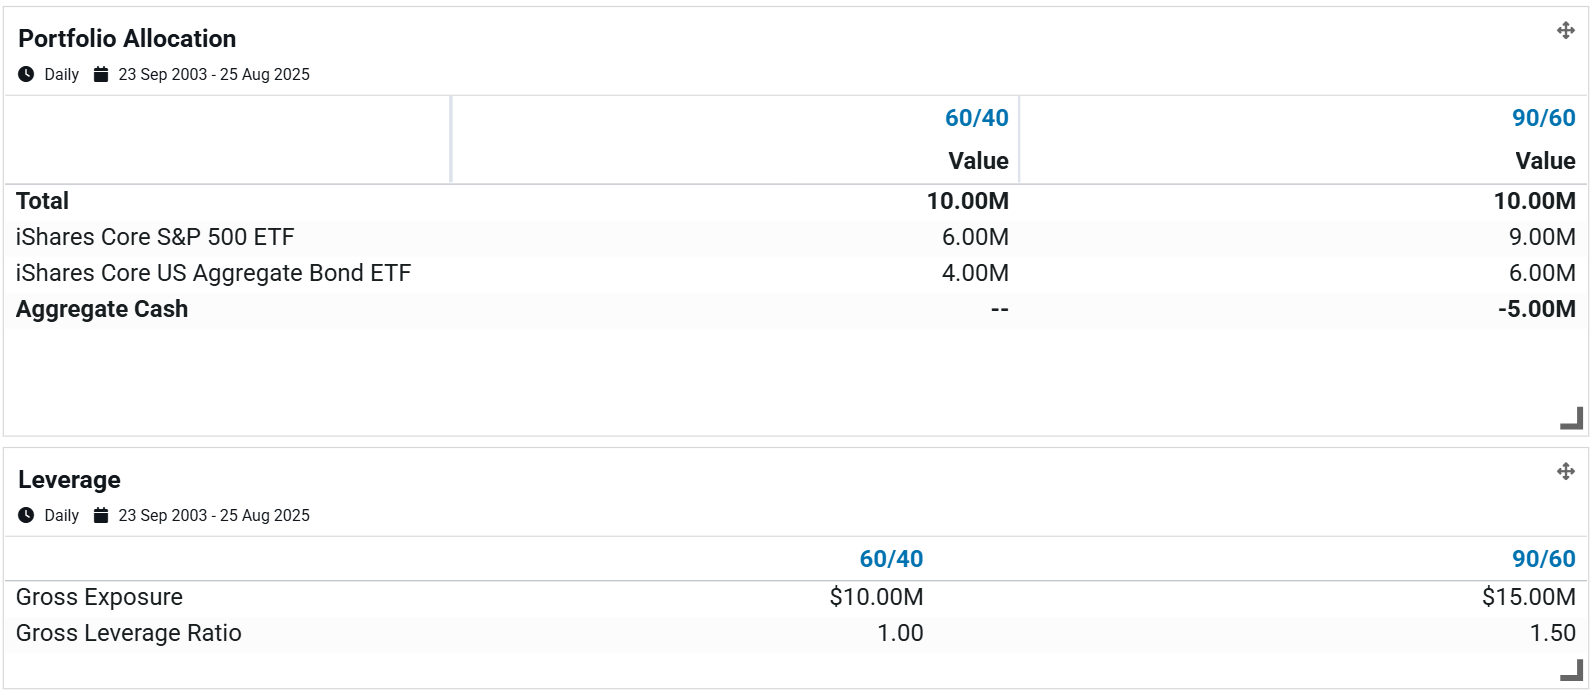
Let’s consider a hypothetical example, starting with $10 million in Exhibit 1:
- On the left, a standard 60/40 portfolio invests the full $10 million with no leverage.
- On the right, we borrow $5 million, allocating $3 million more to equities and $2 million more to fixed income. This effectively transforms the portfolio into a 90/60 allocation. Here, the net asset value remains $10 million, but gross exposure increases to $15 million, resulting in a gross leverage ratio of 1.5x.
Exhibit 1: 60/40 versus 90/60 Allocations and Leverage
 Source: Venn by Two Sigma.
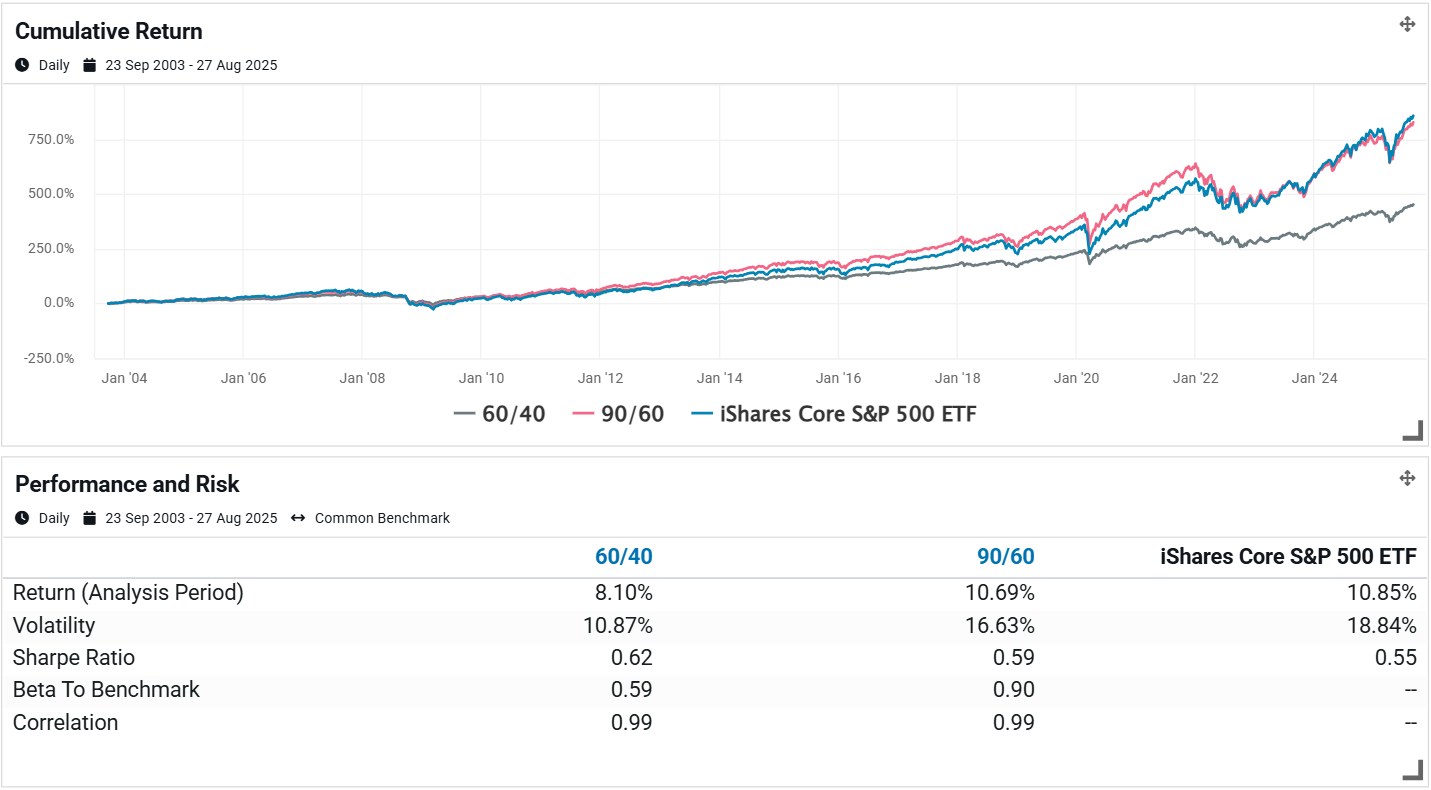
Exhibit 2 compares cumulative returns against the iShares Core S&P 500 ETF (IVV) and presents summary statistics.
Exhibit 2: Performance and Risk of a 60/40 and 90/60
 Source: Venn by Two Sigma.
We found that:
- The 90/60 portfolio delivered both higher returns and higher risk than the 60/40, producing results similar to those of the S&P 500.
- Both portfolios exhibited similar arithmetic Sharpe Ratios1, which aligns with the expectation that leverage amplifies both risk and return. The reason for the 90/60 portfolio’s slightly lower Sharpe Ratio is due to financing costs.
- While correlations to the S&P 500 remained identical, the 90/60's beta was meaningfully higher, driven by its increased volatility.
Factor Analysis with the Two Sigma Factor Lens:
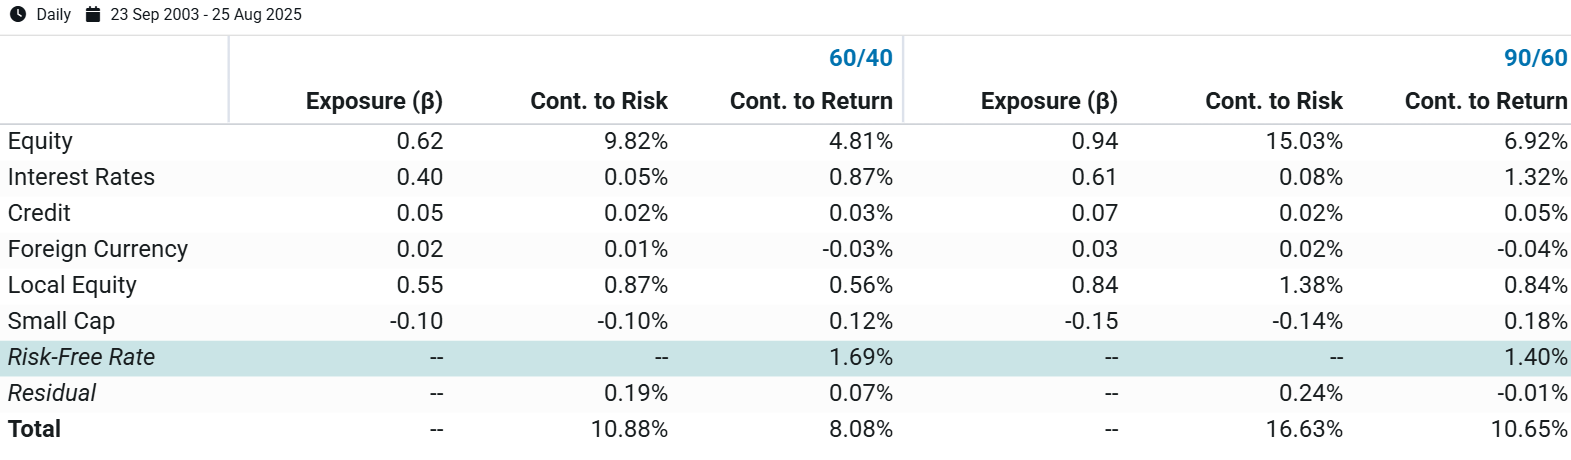
In Exhibit 3, the Two Sigma Factor Lens provides deeper insight into exposure, risk, and return of these portfolios.
Exhibit 3: Two Sigma Factor Lens decomposition of a 60/40 and 90/60
 Source: Venn by Two Sigma.
- The 90/60 portfolio had an Equity factor beta of 0.94 and an Interest Rates factor beta of 0.61. This was proportionally aligned with the 60/40's exposures of 0.62 and 0.40, respectively.
- Equity, Interest Rates, and Local Equity factors were the three largest drivers of return for both portfolios, with the 90/60 realizing higher returns from each factor via leverage.
- The financing costs are reflected in the 90/60 portfolio's lower risk-free rate contribution to return, implying a hypothetical financing cost of roughly 29 bps per year.
Leverage and Volatility Drag
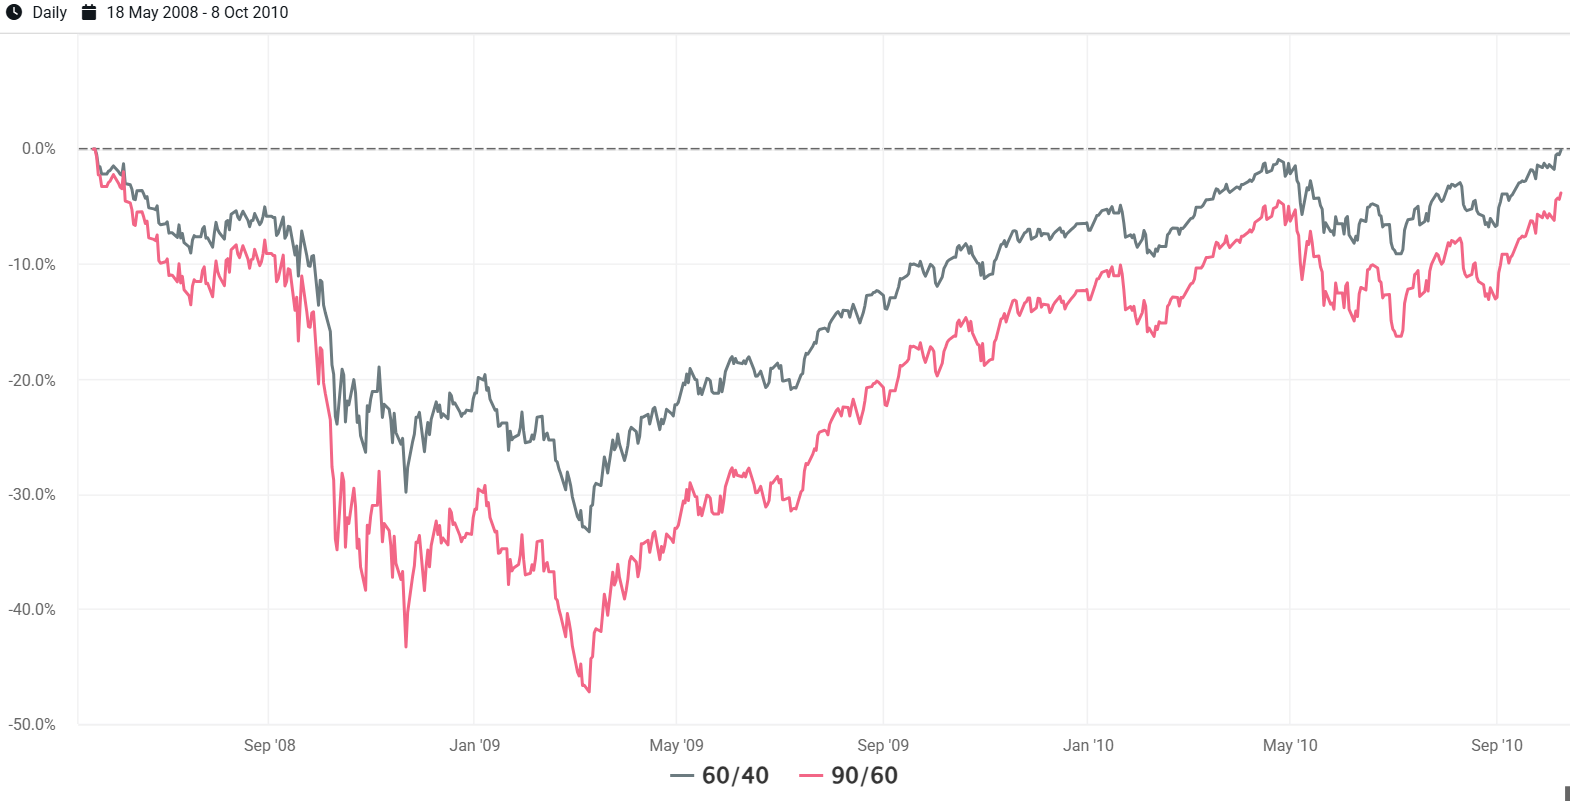
An important consideration with leveraged strategies is volatility drag. Due to compounding effects, deeper losses require disproportionately larger gains to recover, meaning higher volatility reduces return effectiveness over time.
Exhibit 4 demonstrates this during the Global Financial Crisis. At maximum drawdowns, the 90/60 portfolio declined about 47 percent, while the 60/40 dropped 33 percent. To recover, the leveraged portfolio required an approximate 89 percent gain (about 1.9 times the drawdown), while the 60/40 needed an approximate 50 percent gain (1.5 times the drawdown). As a result, the 60/40 portfolio recovered to breakeven faster than the 90/60 during the GFC drawdown.2
Exhibit 4: 60/40 and 90/60 Drawdown and Recovery During the GFC
 Source: Venn by Two Sigma.
The above example is rather subtle since it uses a 60/40 portfolio. Leveraged and higher-volatility assets that experience significant drawdowns can deliver meaningfully different or lower returns than might be expected, due to the volatility and path of their compounded returns. A separate blog post might be warranted for those interested in learning more!
More generally speaking, it is also worth noting that Venn will not show analysis if a margin call would have hypothetically taken place over the analysis period.
Analyzing a Levered 130/30 Strategy
Another common approach that combines leverage and shorting is the 130/30 portfolio. In this strategy, investors obtain an extra 30 percent of long exposure by shorting the same amount in other assets.
For example, suppose an investor seeks greater Momentum factor exposure than allocating $10 million to the iShares Momentum ETF (MTUM). One way to achieve this is by shorting $3 million of the S&P 500 ETF (IVV) and investing those proceeds in MTUM, as shown in Exhibit 5.
Exhibit 5: 130/30 Allocation and Leverage
Source: Venn by Two Sigma.
A good question an investor may ask is: “why not just borrow cash and invest more in MTUM that way?” They certainly could, but this would also increase their Equity beta by roughly 30 percent, which may not be desirable.
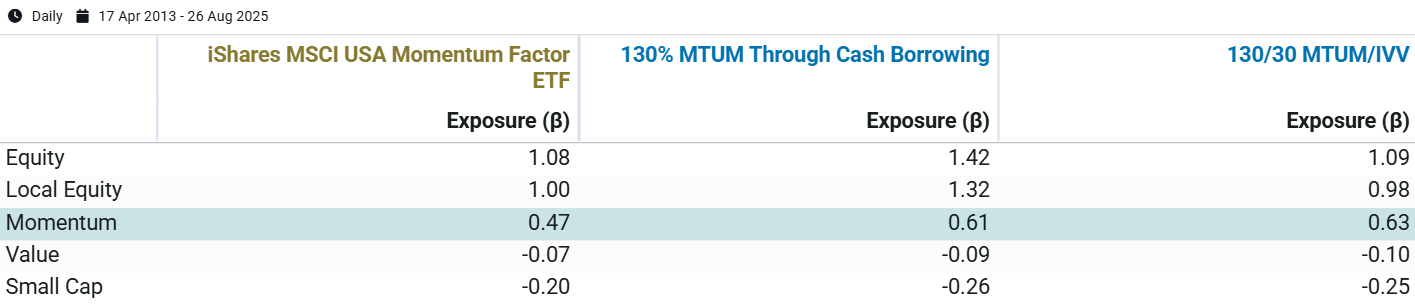
Exhibit 6 quantifies these tradeoffs by analyzing the factor exposures of a standalone allocation to MTUM, a 130% allocation that uses cash borrowing, and a 130/30 that uses short positioning.
The “130% MTUM Through Cash Borrowing” strategy leads to an Equity beta of 1.42 and a local Equity beta of 1.32. In contrast, the 130/30 portfolio does not meaningfully change its Equity beta (1.09) compared to a standalone MTUM position (1.08), but its Momentum beta is increased by about 30 percent.
Exhibit 6: Factor Exposure of Different Momentum Approaches
 Source: Venn by Two Sigma.
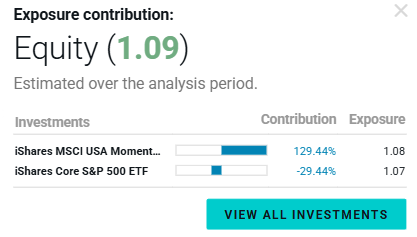
By funding the additional MTUM investment through shorting IVV rather than borrowing cash, the investor can better isolate the goal of increasing Momentum exposure while offsetting extra Equity exposure. This can be shown quantitatively in the factor contribution to return in Exhibit 7.3
Exhibit 7: Equity Exposure Contribution of the 130/30
Source: Venn by Two Sigma.
Measuring Benefits Against Costs
Using factor analysis, we can also understand if this extra Momentum exposure was rewarded:
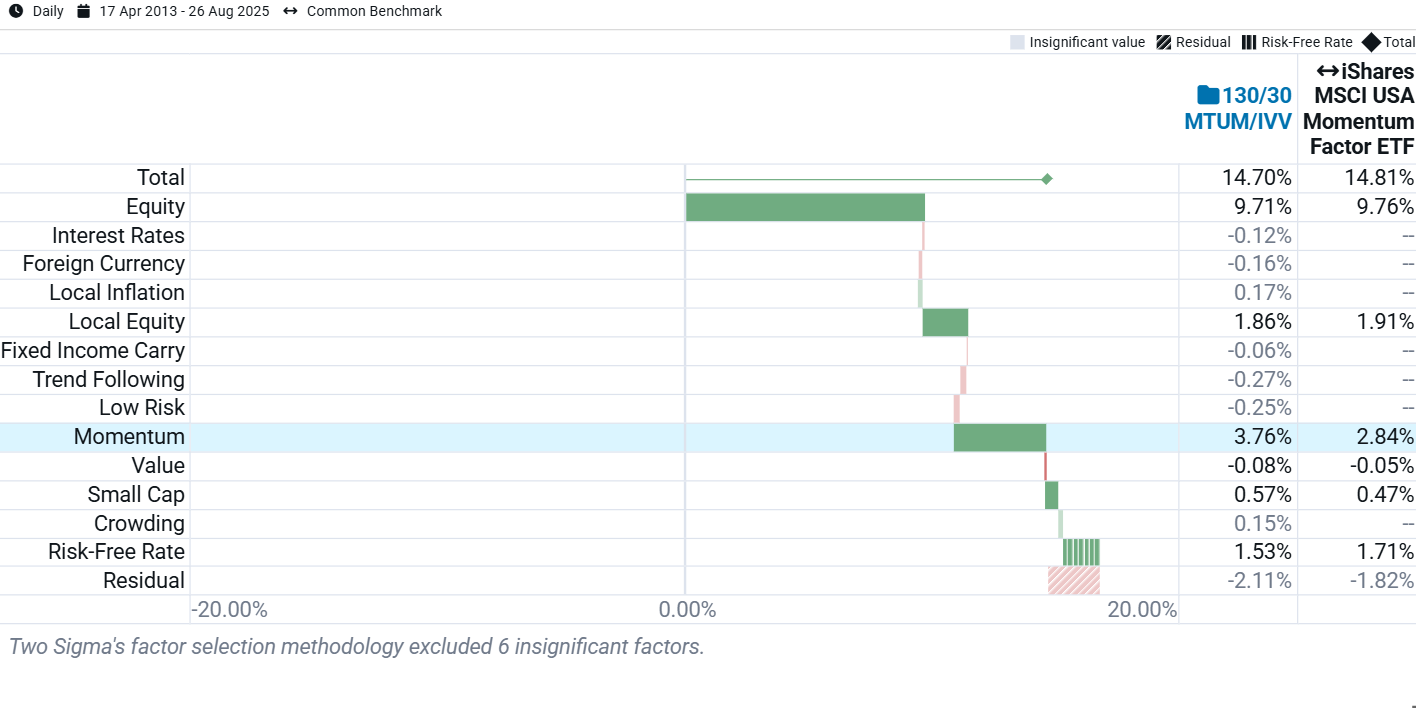
- Exhibit 8 shows that Momentum added 3.76% in annual returns for the 130/30 portfolio, compared to 2.84% for MTUM alone. This represents a 92 basis point per year increase.
- The difference in risk-free rate contributions estimates the hypothetical implementation cost of the 130/30 strategy at approximately 18 basis points annually.
- The 130/30 strategy does show many more factors as contributing to return, but most of these are gray, indicating they were not statistically significant.
Exhibit 8: Factor Contribution to Return
 Source: Venn by Two Sigma.
Expanding Our Toolkit
We believe actionable insights emerge at the intersection of academic rigor and intuitive user experience. Over the years, this dedication has driven our work in returns-based factor analysis, polished reporting, and purpose-built analytics for multi-asset portfolios and private assets.
In this spirit, we are excited to meet client demand with tools to model both leverage and shorting. We believe these enhancements empower Venn users to better understand, act on, and manage sophisticated strategies, increasing clarity to asset allocation and risk management processes.
References:
1Venn uses arithmetic Sharpe Ratio (averaged returns in the numerator), meaning that the higher volatility from leverage doesn't penalize returns as it would when using a geometric Sharpe Ratio (compounded returns in the numerator). Compounded returns suffer from “volatility drag”, which is discussed in depth later in this blog. Without financing costs, we would expect arithmetic Sharpe Ratios to be the same. Geometric Sharpe Ratios, however, would be expected to be much more differentiated.
2While this example primarily illustrates volatility drag from leverage raising volatility, financing costs also contributed to deeper drawdowns, further amplifying the volatility drag effect.
3The beta being exactly offset at 29.44% is pure coincidence!
Exposure to risk factors is not a guarantee of increased performance or decreased risk.
References to the Two Sigma Factor Lens and other Venn methodologies are qualified in their entirety by the applicable documentation on Venn.
This article is not an endorsement by Two Sigma Investor Solutions, LP or any of its affiliates (collectively, “Two Sigma”) of the topics discussed. The views expressed above reflect those of the authors and are not necessarily the views of Two Sigma. This article (i) is only for informational and educational purposes, (ii) is not intended to provide, and should not be relied upon, for investment, accounting, legal or tax advice, and (iii) is not a recommendation as to any portfolio, allocation, strategy or investment. This article is not an offer to sell or the solicitation of an offer to buy any securities or other instruments. This article is current as of the date of issuance (or any earlier date as referenced herein) and is subject to change without notice. The analytics or other services available on Venn change frequently and the content of this article should be expected to become outdated and less accurate over time. Two Sigma has no obligation to update the article nor does Two Sigma make any express or implied warranties or representations as to its completeness or accuracy. This material uses some trademarks owned by entities other than Two Sigma purely for identification and comment as fair nominative use. That use does not imply any association with or endorsement of the other company by Two Sigma, or vice versa. See the end of the document for other important disclaimers and disclosures. Click here for other important disclaimers and disclosures.