
The Venn by Two Sigma team regularly speaks with investors and advisors about materials for upcoming Client, Investment Committee (IC) and Board meetings. A lot of prep work, analysis and time go into creating these materials. To assist, we have built several workflows in Venn, with the goal of speeding up calculations and helping you analyze your portfolios using traditional risk/return metrics, as well as risk factors.
Below, we have highlighted some of Venn’s many useful analyses to consider using in your materials. We have provided images of sample outputs that you can export or paste into a presentation, depending on your subscription, as well as example takeaways for each of the analyses discussed, to give you a sense of the stories you can tell your audience.
Historical Performance and Risk Statistics
After uploading your investments’ returns, updating your latest Investment NAVs and adding in your portfolio’s benchmark, you can customize the Performance and Risk block to see helpful metrics such as Beta to Benchmark, Batting Average and other risk statistics.
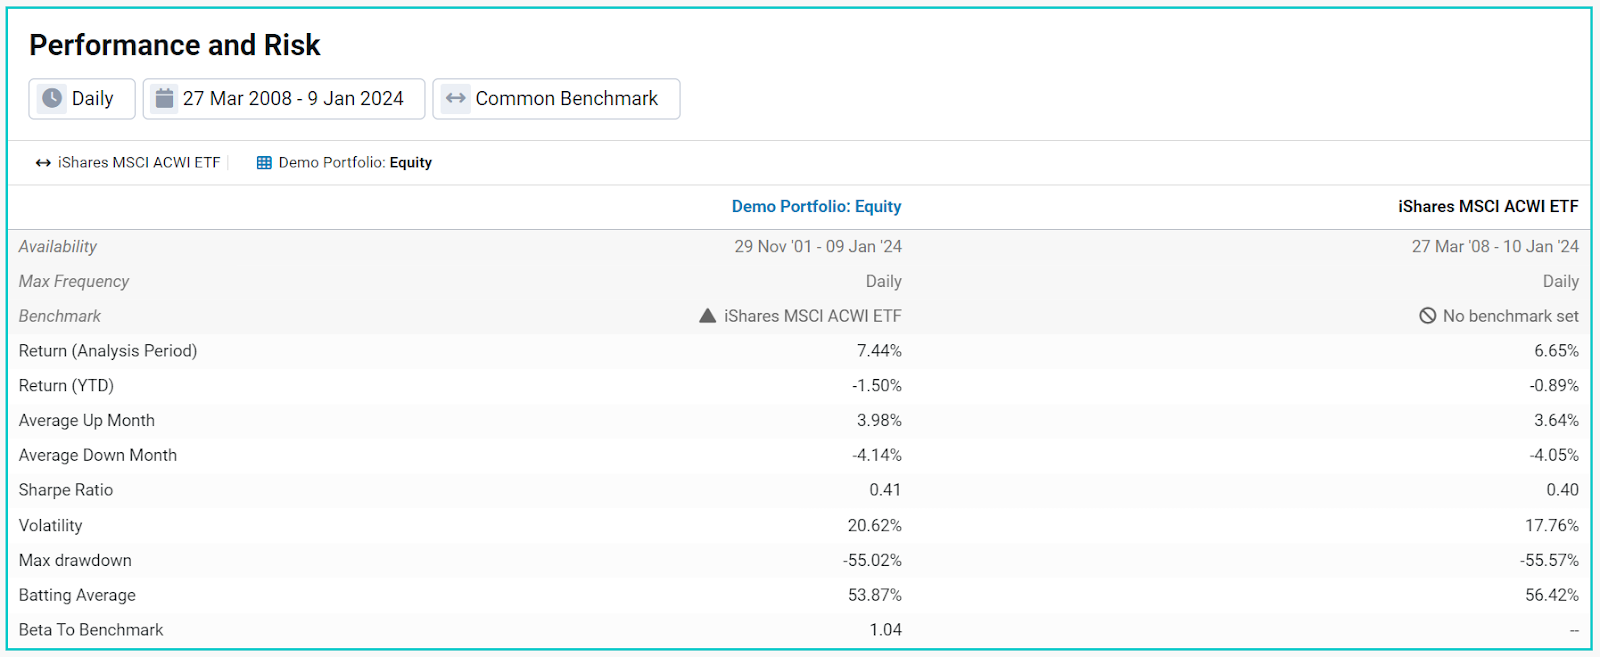
Source: Venn by Two Sigma.
Takeaway: Is this Beta to your benchmark of 1.04 expected? Is it close to your target, or within your target range? If not, it might be worth revisiting your portfolio allocations.
Factor Exposure and Contribution Analysis
Deeply understanding your portfolio’s diversification is a common focus of Board and IC members, as well as of clients. In addition to viewing the traditional asset class breakdown on the allocator panel, utilize Venn’s Factor Analysis to view your portfolio’s exposures to risk factors, as well as contributions to risk and return.
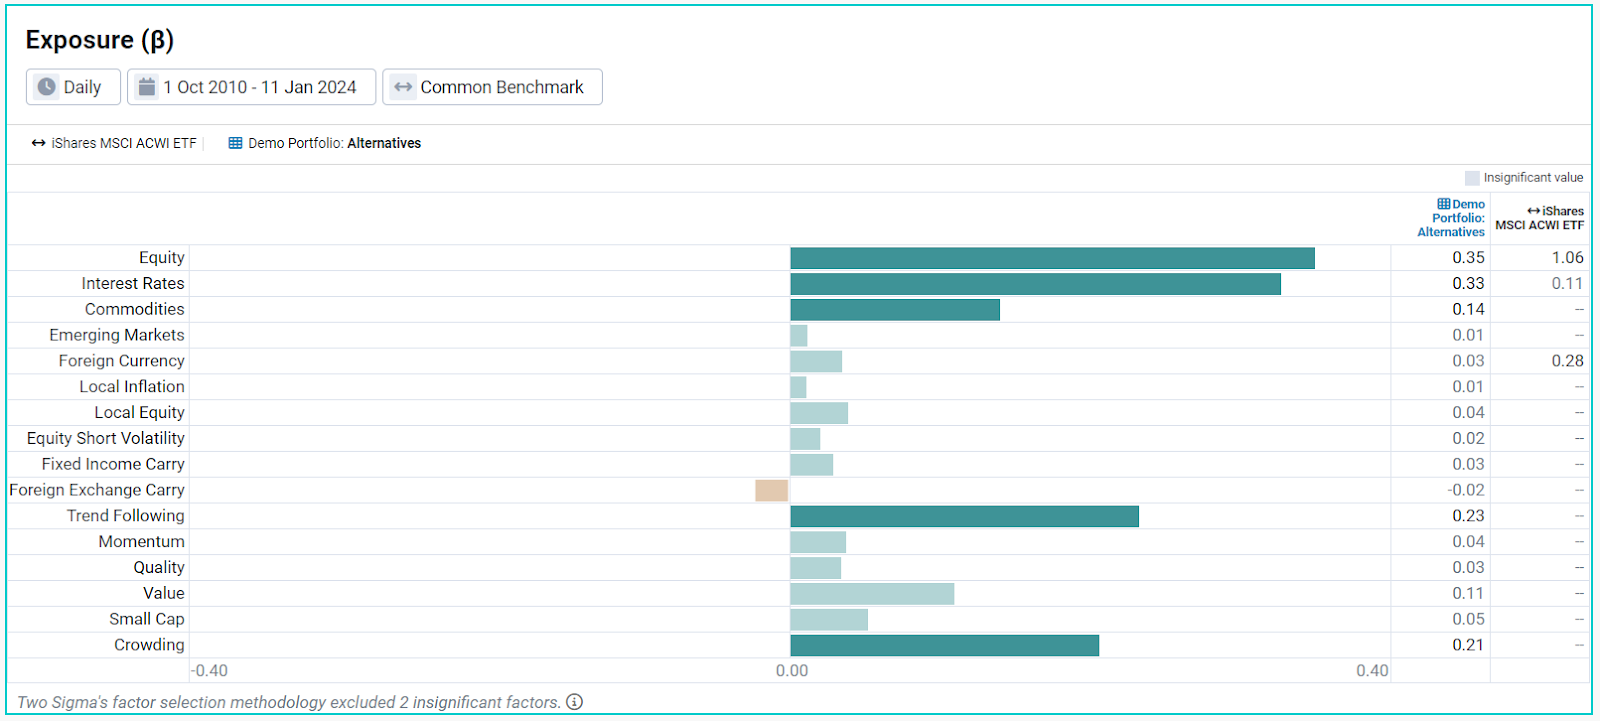
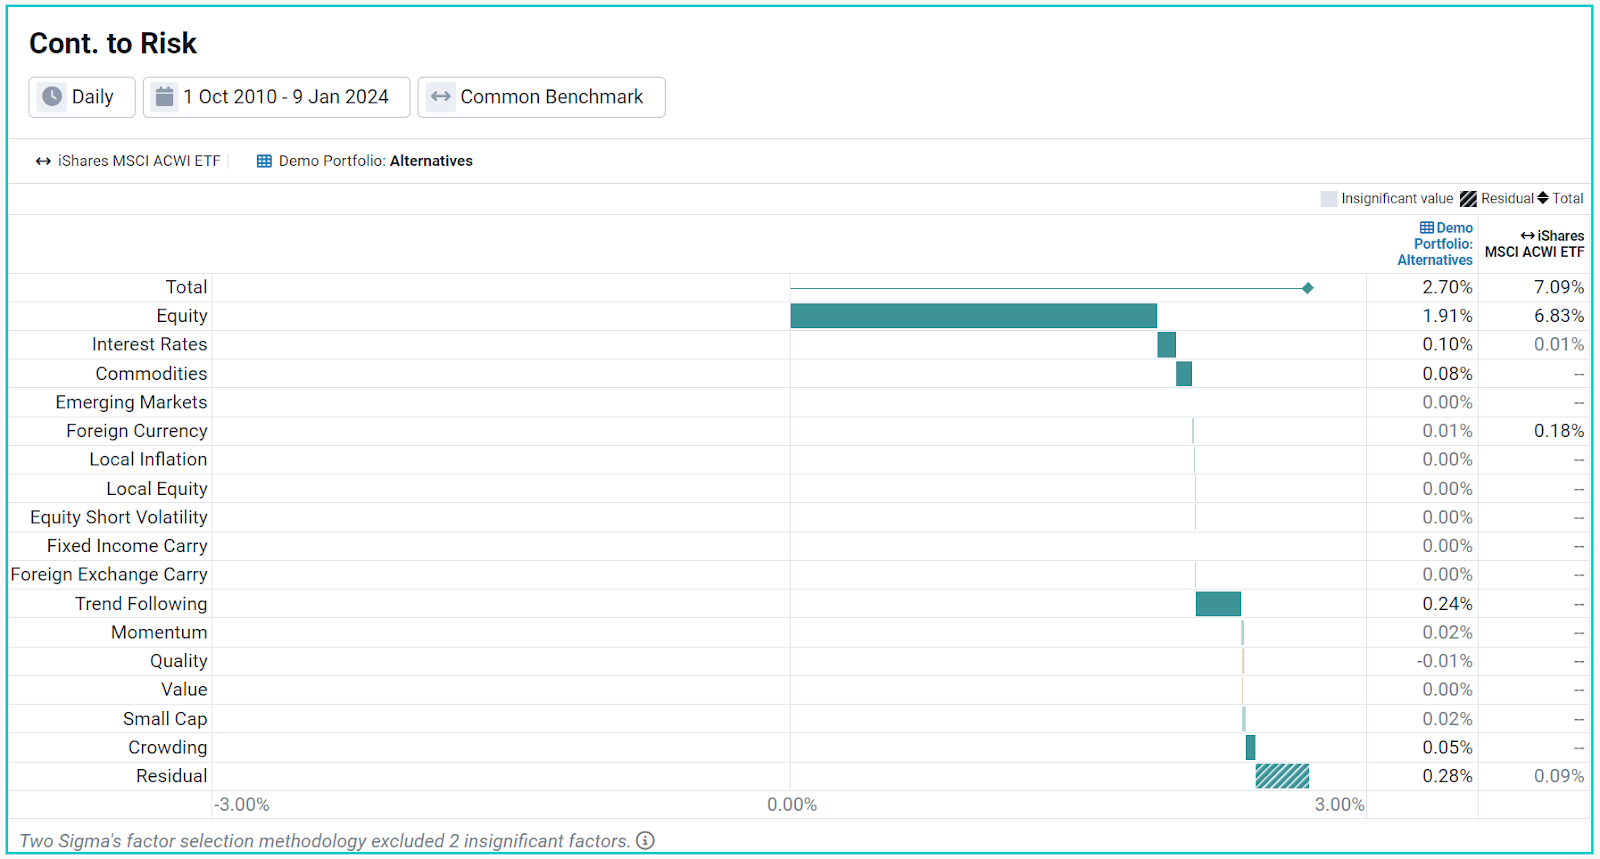
Source: Venn by Two Sigma.
Takeaway: As per the Factor Contribution to Risk chart, it appears that 0.28% of the demo portfolio’s risk is coming from “Residual,” meaning it cannot be explained by the factors alone. That said, from looking at the Factor Contribution to Return chart, that residual component has been hurting the portfolio’s performance, accounting for -1.58% of the total portfolio’s 4.67% annualized return historically. To go a step further, one can click on the Residual bar to see which managers are contributing to this negative return. Does your IC/Board/client expect these managers’ residual performance to turn around in the future or continue to drive poor performance? Also, toggle on “Relative to Benchmark” to understand how your portfolio’s risk contributors differ from your chosen benchmark.
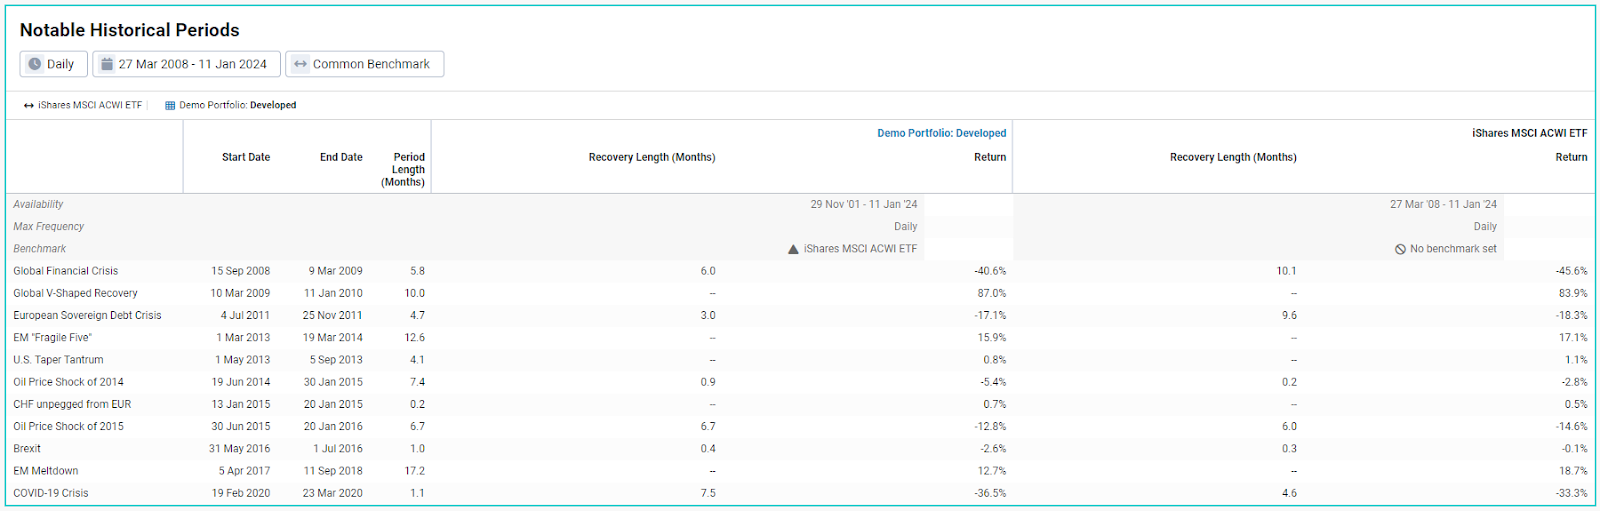
Notable Historical Periods
Notable Historical Periods can help you understand the historical performance of your managers or portfolios during well-known periods, as identified by Venn.
Source: Venn by Two Sigma.
Takeaway: Use this output to summarize the current portfolio’s backtested drawdowns. How would my portfolio, as it's positioned today, have performed during these notable periods? Is the performance during these time periods in line with my expectations, or is there too much downside risk?
Scenario Analysis
Scenario Analysis is a forward-looking tool that shows you what a future shock to a particular index might mean for your portfolio. Select from over a dozen indices and input your projected return for that index or market condition. By translating each return into the shared language of factor exposures, Venn can then estimate how a shock to the scenario index might affect your portfolio and benchmark.
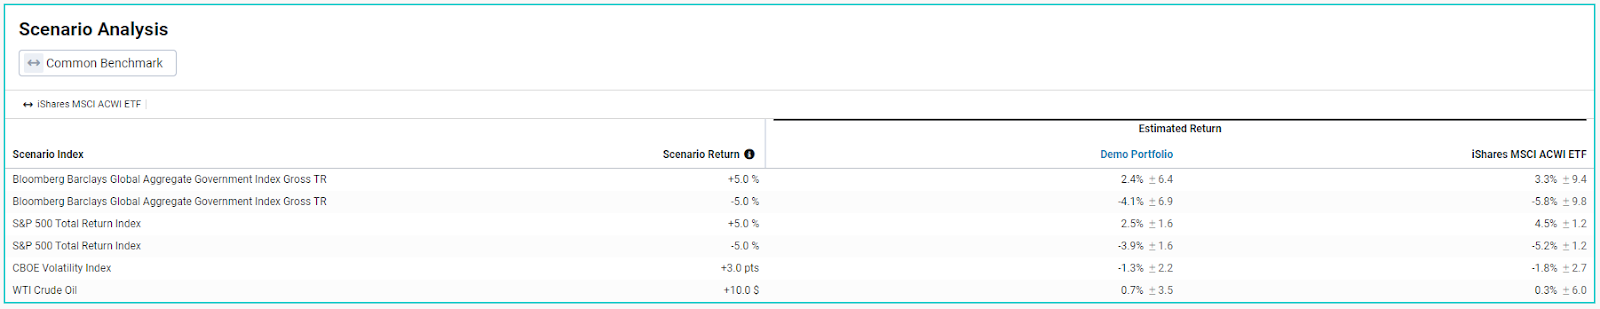
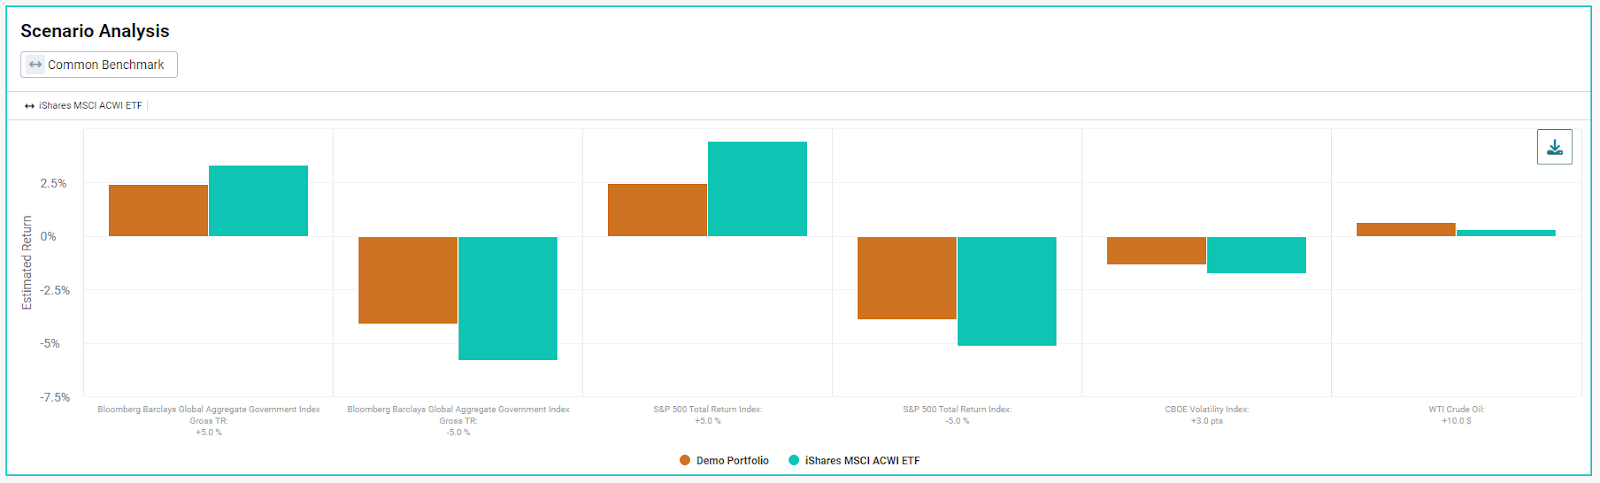
Source: Venn by Two Sigma.
Takeaway: Of all the above scenarios, the worst case for this sample portfolio would be a -5% shock to the “Bloomberg Barclays Global Aggregate Government Index Gross TR.” The best case would be a $5 rise in the “S&P 500 Total Return Index.”
Optimization1
After customizing your long-term forecasts using capital market assumptions (CMAs), use Venn’s optimization tool to see the suggested allocation changes that may help you better achieve your portfolio’s risk/return targets. You can also optimize your portfolio around factor exposures and investment allocation constraints and then present these recommendations to your audience.
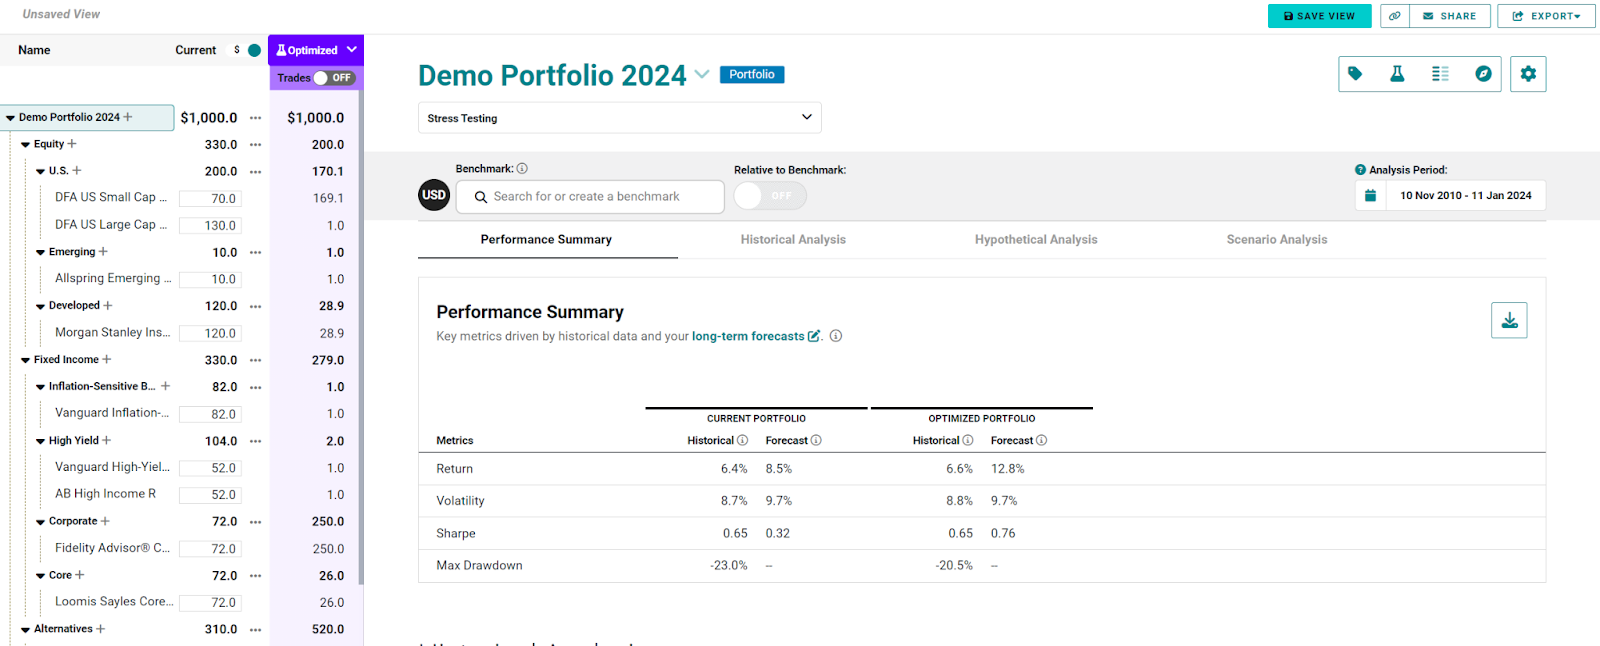
Source: Venn by Two Sigma.
Takeaway: Based on the long-term CMAs, it appears that the Optimized version of the sample portfolio would have a higher forecasted return than the Current Portfolio version (12.8% vs. 8.5%). See the purple “Optimized” column for suggested reallocations to get closer to that Optimized Portfolio.
1 Not available in certain jurisdictions.
Additional Venn Analyses for the Experienced User
There are several other pieces of analysis that you may want to discuss during upcoming Client, Investment Committee (IC) and Board meetings:
Factor Trend
In addition to viewing Factor Exposures for the portfolio over a single analysis period, Venn can show you how those exposures have changed over time by displaying rolling factor exposures on the Factor Trend charts. Use this to help answer: Has my portfolio been exposed to the same factors throughout history, or has there been some style drift? Are there new exposures over the more recent periods and are those intended?
Residual Analysis
As we already saw, an important component of factor-based analysis is the residual, or the amount of risk or return that cannot be explained by the factors in the Two Sigma Factor Lens. For Venn, the residual can represent idiosyncratic sources of risk or return. The Residual Analysis block isolates this component and displays the Residual Return, Volatility and Sharpe ratio, as well as a graphical representation of its growth, or lack thereof, over time.
Hypothetical Drawdown Analysis
Hypothetical Drawdown Analysis was specifically designed to help allocators understand which historical periods, if repeated today, could create a drawdown in a portfolio, even before the available analysis period, given the latest factor exposures as determined on Venn.
Interested in learning more and exploring Venn? Get in touch.
Disclaimer: Exposure to risk factors is not a guarantee of increased performance or decreased risk. Past performance does not guarantee future results. This document is for informational purposes only. Not an offer to buy or sell securities. Click here for Important Disclosure and Disclaimer Information.
The information contained in this article is provided for general informational and educational purposes only, and should not be construed as investment advice. The contributor to this material is associated with a client of Two Sigma Investor Solutions, LP (“TSIS”). Neither TSIS nor its affiliates have compensated the contributor for his statements. The statements from the interview have been edited and reformatted by TSIS with the contributor’s approval. Unless otherwise noted, the contributor’s statements do not represent the actual views or opinions of TSIS or its affiliates, or any officers, directors, or employees thereof.
This article is not an endorsement by Two Sigma Investor Solutions, LP or any of its affiliates (collectively, “Two Sigma”) of the topics discussed. The views expressed above reflect those of the authors and are not necessarily the views of Two Sigma. This article (i) is only for informational and educational purposes, (ii) is not intended to provide, and should not be relied upon, for investment, accounting, legal or tax advice, and (iii) is not a recommendation as to any portfolio, allocation, strategy or investment. This article is not an offer to sell or the solicitation of an offer to buy any securities or other instruments. This article is current as of the date of issuance (or any earlier date as referenced herein) and is subject to change without notice. The analytics or other services available on Venn change frequently and the content of this article should be expected to become outdated and less accurate over time. Any statements regarding planned or future development efforts for our existing or new products or services are not intended to be a promise or guarantee of future availability of products, services, or features. Such statements merely reflect our current plans. They are not intended to indicate when or how particular features will be offered or at what price. These planned or future development efforts may change without notice. Two Sigma has no obligation to update the article nor does Two Sigma make any express or implied warranties or representations as to its completeness or accuracy. This material uses some trademarks owned by entities other than Two Sigma purely for identification and comment as fair nominative use. That use does not imply any association with or endorsement of the other company by Two Sigma, or vice versa. See the end of the document for other important disclaimers and disclosures. Click here for other important disclaimers and disclosures.
This article may include discussion of investing in virtual currencies. You should be aware that virtual currencies can have unique characteristics from other securities, securities transactions and financial transactions. Virtual currencies prices may be volatile, they may be difficult to price and their liquidity may be dispersed. Virtual currencies may be subject to certain cybersecurity and technology risks. Various intermediaries in the virtual currency markets may be unregulated, and the general regulatory landscape for virtual currencies is uncertain. The identity of virtual currency market participants may be opaque, which may increase the risk of market manipulation and fraud. Fees involved in trading virtual currencies may vary.