March and Q1 2022 Venn Factor Performance Report
This Venn Factor Performance Report will consist of two sections: one in which we’ll focus on March 2022 factor performance and another that provides Q1 2022 factor performance.
March 2022 Factor Performance
While geopolitical tensions continued to intensify – with the war between Russia and Ukraine persisting for more than a month and Western countries responding to Russia’s aggression with stern sanctions and support for Ukraine – markets seemed to change their focus to the broader economic backdrop of higher inflation and monetary policy responses from global central banks, with risk-on sentiment dominating markets, notably in the second half of March.

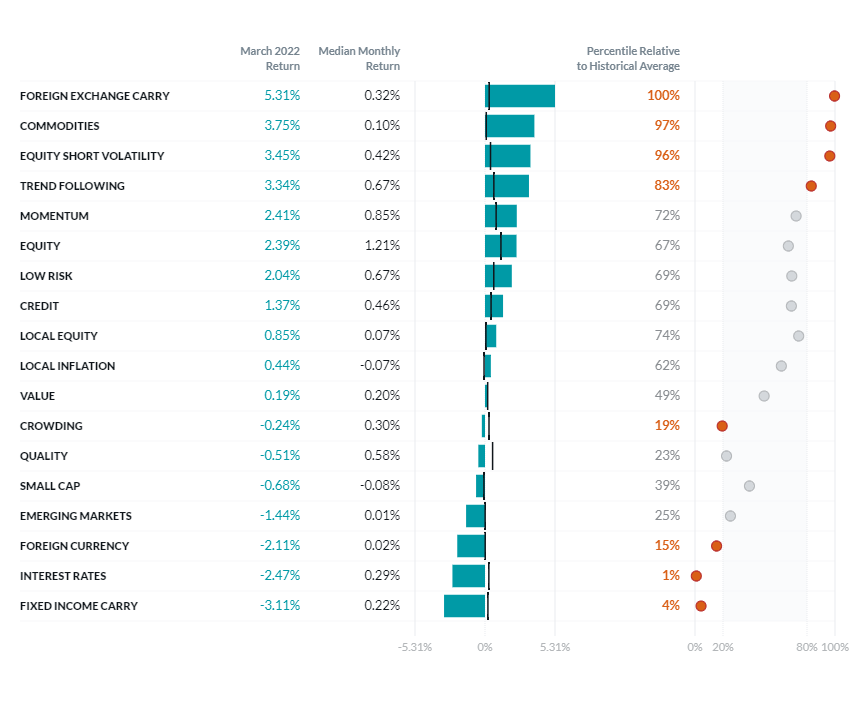
Source: Venn by Two Sigma. The median and percentile columns measure the performance of each factor in the Two Sigma Factor Lens relative to the entire history of the factor in USD, using monthly data for the period March 1995 - March 2022.
- Global stocks rebounded in March, with gains coming in the back-half of the month. Venn’s Equity factor experienced one of its best weeks since its inception from March 14 - March 18, up 5.57%.
- Market participants viewed equities as being oversold, given some of their worst fears about the economy hadn’t materialized.1 Meanwhile, the Fed offered investors clarity on its plan to tame inflation during the FOMC meeting on March 16, voting to raise interest rates for the first time since 2018 by a quarter point to a range of 0.25% - 0.50%. They also signaled at least 6 more hikes by the end of this year. Most Fed officials expect the fed-funds rate to rise to at least 1.875% by the end of this year and 2.75% by the end of 2023. Fed Chair Powell shared greater concern that higher inflation might persist due to a booming job market and wages rising at their fastest pace in years.2
- On the back of the Fed’s decision to begin the rate-hiking cycle, yields rose and Venn’s Interest Rates factor fell. Yields rise as prices fall.
- While the 10-year yield in the US moved from 1.83% to 2.32% over the course of the month,3 yields on shorter maturities soared even more, with some parts of the curve inverting in the final week of March.4 This capped one of the worst months on record for the Interest Rates factor (since the inception of the Two Sigma Factor Lens, March 1, 1995).
- The Commodities factor moved higher for a fourth month in a row, with some commodities indices wrapping their best quarter in more than 30 years.5
- As reported in our special edition VFPR on the effects of the Russia-Ukraine War, significant gains were observed during the first two weeks of the month, with the Commodities factor finishing March relatively flat from that point on.
- In the first quarter, the commodities market rally that had started at the end of 2021, due to higher consumer demand, was exacerbated by a supply shock as a result of the Russia-Ukraine War. A rapid increase in the price of oil propelled gasoline prices to record levels. Wheat gained 31% on the year, trading at its highest level since 2010, while corn was also up 26%. Metals prices soared, with aluminum, copper, nickel, and palladium all hitting new highs.5
- Credit spreads narrowed below levels seen just prior to Russia’s invasion of Ukraine, which is consistent with the risk-on tone driven by stronger than expected economic data.4 The Credit factor rose modestly as a result, with most gains coming in the last two weeks of the month.
- The Foreign Currency factor fell in March due to a strengthening dollar and as a result of the factor’s residualization process.
- The ICE US Dollar index, which tracks the currency against a basket of others, surged early in the month. As investor anxiety swelled due to geopolitical tensions, investors were attracted to the dollar’s reserve currency status. A healthy US economy relative to other countries has also spurred investors to buy dollar-denominated assets, further supporting the currency later in the month.6 Notably, a downgrade to growth expectations in the Eurozone drove the USD/EUR pair upwards.7
- Furthermore, the Foreign Currency factor also fell as a result of its residualization to the Equity, Credit, Commodities, and Interest Rates factors. Positive performance coming from the first three factors was backed out of the Foreign Currency factor’s return, leading it lower on the month.
- Within Macro Styles:
- The Foreign Exchange Carry factor experienced its second best month on record (since the inception of the Two Sigma Factor Lens, March 1, 1995), only falling short of gains seen in May 2002 – when huge trade deficits and worries about the US economy and stocks pushed the USD into a tailspin, eventually falling below parity with the EUR a few months later.8 This time, tailwinds for the USD, namely rising US treasury yields, rewarded investors who take advantage of interest rate differentials for a second month in a row as other lower-yielding currencies like the Japanese Yen have continued to fall.9
- The Fixed Income Carry factor was the worst performing factor in the lens in March. While the factor was positioned long US, Australian, and European government bonds and short UK, Canadian, and Japanese government bonds, yields rose more in the former than in the latter. The factor’s residualization to Interest Rates helped stem even more severe losses, as the raw factor input was down -5.67%.
- While the VIX spiked during the first week of the month, coinciding with escalations of the Russia-Ukraine War, it retreated downward and accelerated the trend after the Fed’s announcement in the middle of the month.10 As a result, the Equity Short Volatility factor recorded gains for a fourth month in a row, now up 9.38% since the beginning of December 2021.
- The Trend Following factor simultaneously moved upwards in March, with positive contributions coming from Commodities, Fixed Income, and Currencies, outweighing a marginally negative contribution from Equities. Long positioning in commodities and a broad-based commodities market rally provided meaningful support.
- Within Equity Styles:
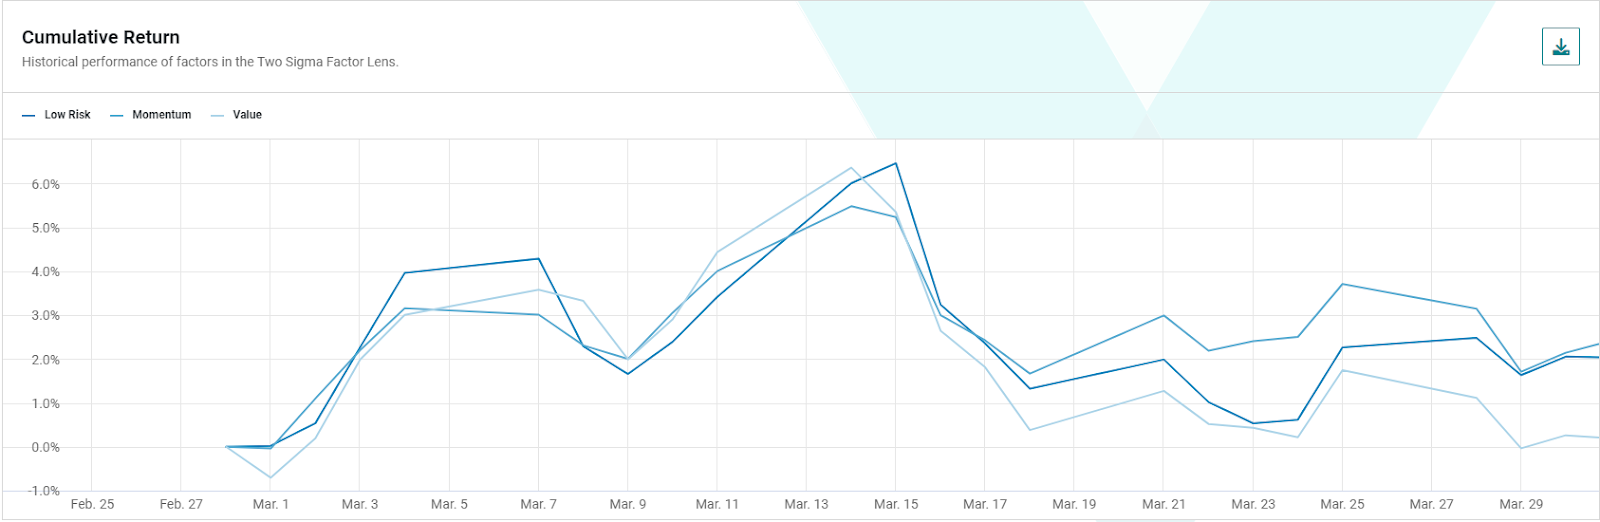
- Modest month-end performance masked a roller coaster ride for investors that seek to gain exposure to the Low Risk, Value, and Momentum factors. We wrote about the factor rotation that occurred during the first two weeks of the month here. The up and down cycle only continued in the weeks that followed, as the market digested several waves of news. Low Risk, Value, and Momentum were all highly positively correlated on both an absolute basis and relative to their long term averages over the course of the month (see Exhibit A). At some points, they moved nearly in lock step (see Exhibit B).
- Lastly, the Crowding factor suffered in March, with most losses coming in the first two weeks of the month, as some hedge funds chose to de-risk their portfolios and cover short positions.11
(Exhibit A) Correlations from March 1 - March 31, 2022: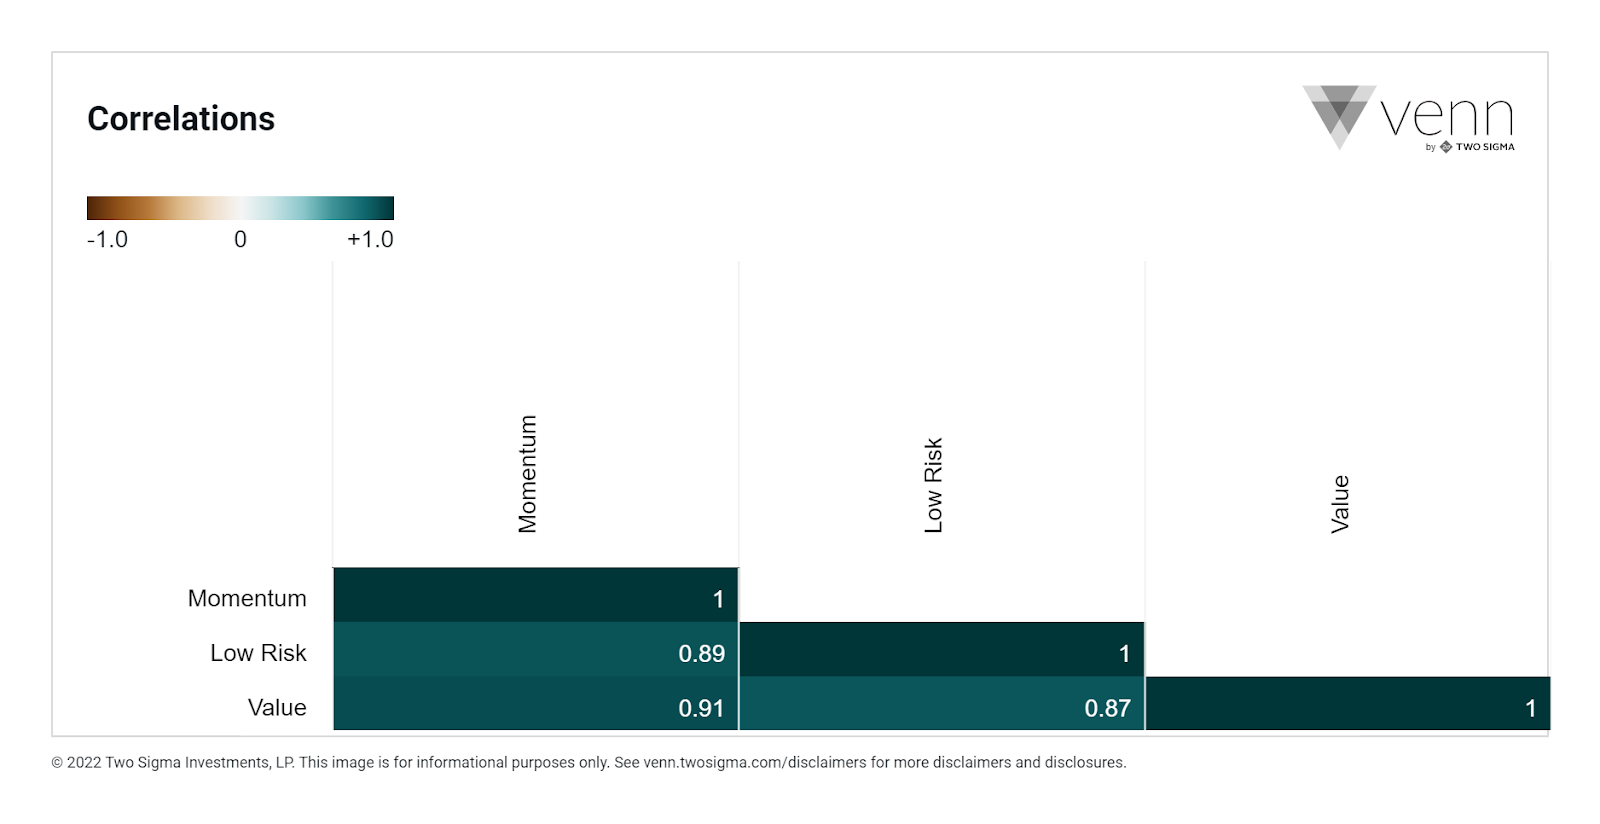
(Exhibit B) Cumulative Factor Performance (Low Risk, Momentum, and Value) from March 1 - March 31, 2022:
Q1 2022 Factor Performance:
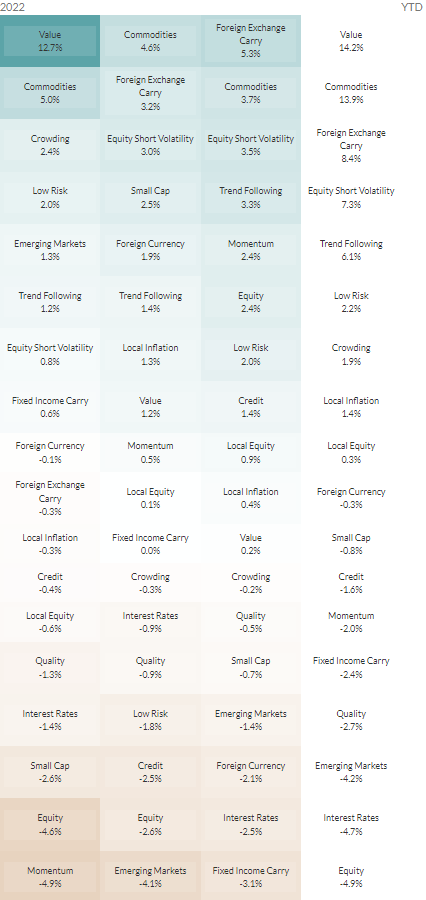
The table below shows factor returns for January 2022, February 2022, March 2022, and Q1 2022 chronologically from left to right. The color scale indicates the degree to which a factor’s return was either positive (teal) or negative (amber) during the observed monthly period. Within Macro Factors, the Commodities factor was the biggest winner, while the Equity and Interest Rates factors were near equal losers, quickly followed by the Emerging Markets factor. Within Style Factors, the Value factor was the clear winner, largely due to an historic positive return in January.

References to the Two Sigma Factor Lens and other Venn methodologies are qualified in their entirety by the applicable documentation on Venn.
REFERENCEs
2https://www.wsj.com/articles/fed-raises-interest-rates-for-first-time-since-2018-11647453603
3 https://fred.stlouisfed.org/series/DGS10
4https://www.nasdaq.com/articles/march-first-quarter-2022-review-and-outlook
5https://www.wsj.com/articles/commodities-are-poised-for-best-quarter-in-32-years-11648732317
6https://www.wsj.com/articles/dollar-strength-builds-as-ukraine-war-deepens-11646575604
8https://money.cnn.com/2002/07/15/markets/bonds/
9https://www.svb.com/trends-insights/daily-fx-update2/dollar-stronger-as-treasury-yields-rise
10https://www.cboe.com/us/indices/dashboard/VIX/
This article is not an endorsement by Two Sigma Investor Solutions, LP or any of its affiliates (collectively, “Two Sigma”) of the topics discussed. The views expressed above reflect those of the authors and are not necessarily the views of Two Sigma. This article (i) is only for informational and educational purposes, (ii) is not intended to provide, and should not be relied upon, for investment, accounting, legal or tax advice, and (iii) is not a recommendation as to any portfolio, allocation, strategy or investment. This article is not an offer to sell or the solicitation of an offer to buy any securities or other instruments. This article is current as of the date of issuance (or any earlier date as referenced herein) and is subject to change without notice. The analytics or other services available on Venn change frequently and the content of this article should be expected to become outdated and less accurate over time. Any statements regarding planned or future development efforts for our existing or new products or services are not intended to be a promise or guarantee of future availability of products, services, or features. Such statements merely reflect our current plans. They are not intended to indicate when or how particular features will be offered or at what price. These planned or future development efforts may change without notice. Two Sigma has no obligation to update the article nor does Two Sigma make any express or implied warranties or representations as to its completeness or accuracy. This material uses some trademarks owned by entities other than Two Sigma purely for identification and comment as fair nominative use. That use does not imply any association with or endorsement of the other company by Two Sigma, or vice versa. See the end of the document for other important disclaimers and disclosures. Click here for other important disclaimers and disclosures.
This article may include discussion of investing in virtual currencies. You should be aware that virtual currencies can have unique characteristics from other securities, securities transactions and financial transactions. Virtual currencies prices may be volatile, they may be difficult to price and their liquidity may be dispersed. Virtual currencies may be subject to certain cybersecurity and technology risks. Various intermediaries in the virtual currency markets may be unregulated, and the general regulatory landscape for virtual currencies is uncertain. The identity of virtual currency market participants may be opaque, which may increase the risk of market manipulation and fraud. Fees involved in trading virtual currencies may vary.